Are You Using The Wrong Trade Area For Your GIS Research?
Have GIS Research Been Flawed For Years, And How Can New Tools Help Solve The Problem?
By Brian Vercelli
Published July 21, 2023

By Brian Vercelli
Published July 21, 2023
Remember not too long ago when you were checking out at the register of your local sporting goods, office supply, or pet store and they would always ask for your home Zip Code? I feel that I haven't been asked that question at a retail location anywhere in quite some time. Now, in 2023 I can certainly give you quite a few reasons why the Zip Code (and other data in general) isn't as prominent as it once was, but really all of that reminded me of an article published by Matt Forrest at Carto, on why the Zip Code just isn't a great boundary for use in analyzing demographics, site selection and in general many things. It brings up some great points and explains the history of what a Zip Code is and why we use it.
Throughout my time at Sites USA, I've held many different positions including Technical Support and GIS Map Technician. I've trained users on the ins and outs of basic GIS functionality, how to use demographics to model and analyze locations, and have been able to create many informative story-telling maps, some with Zip Codes.
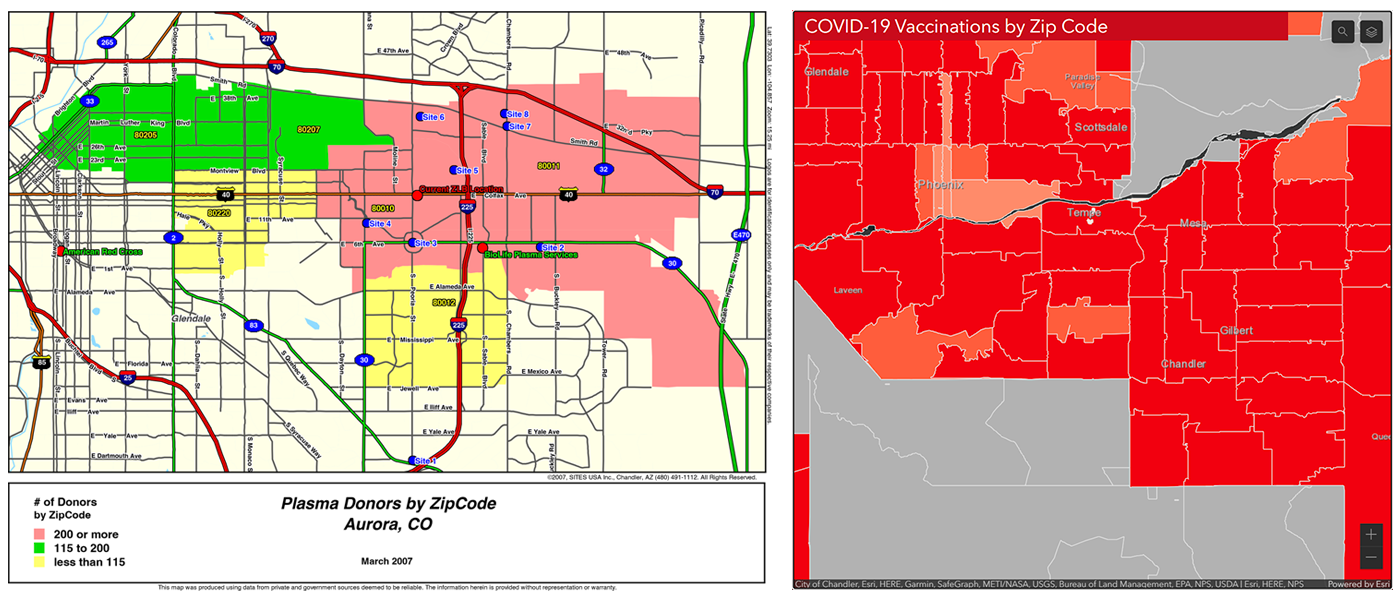
Over the years there have been many occasions where our users of REGIS Online have inquired about running a Zip Code study, maybe they want to show the demographic shift of an area, display known customer locations, or create a simple heatmap of sales data per Zip Code. Also, during the start of the COVID-19 pandemic, the Arizona Department of Health Services (and many others) offered maps of active cases and vaccinations by Zip Code which were helpful. As we can see, many different possibilities exist to use these geographic boundaries. However, if we examine really what a Zip Code boundary is, all of its flaws, and the difference between sources, one may want to steer clear and possibly choose an alternative source for their mapping needs.
Let's take a deeper look into a specific Zip Code to examine what some of these issues are. Fortunately (or to some, unfortunately) living in Arizona my whole life, I've been able to see the surreal transformation of the Phoenix Metro area and surrounding suburbs. Over the last 20 years, we've had multiple freeway projects completed and both the East & West Valley areas have just exploded in new housing and commercial developments.
For this example, let's take a look at the growing east-valley suburb of Queen Creek and its main Zip Code - 85142. Queen Creek itself has gone from a small rural suburb to doubling their residents in just the last 10 years (114% growth from 2010-2020). But if we wanted to look at population statistics or other demographics on that main 85142 Zip Code, that's where we can run into some trouble. Here are 4 different mapping providers' boundaries of 85142. I think you can start to see the issue.
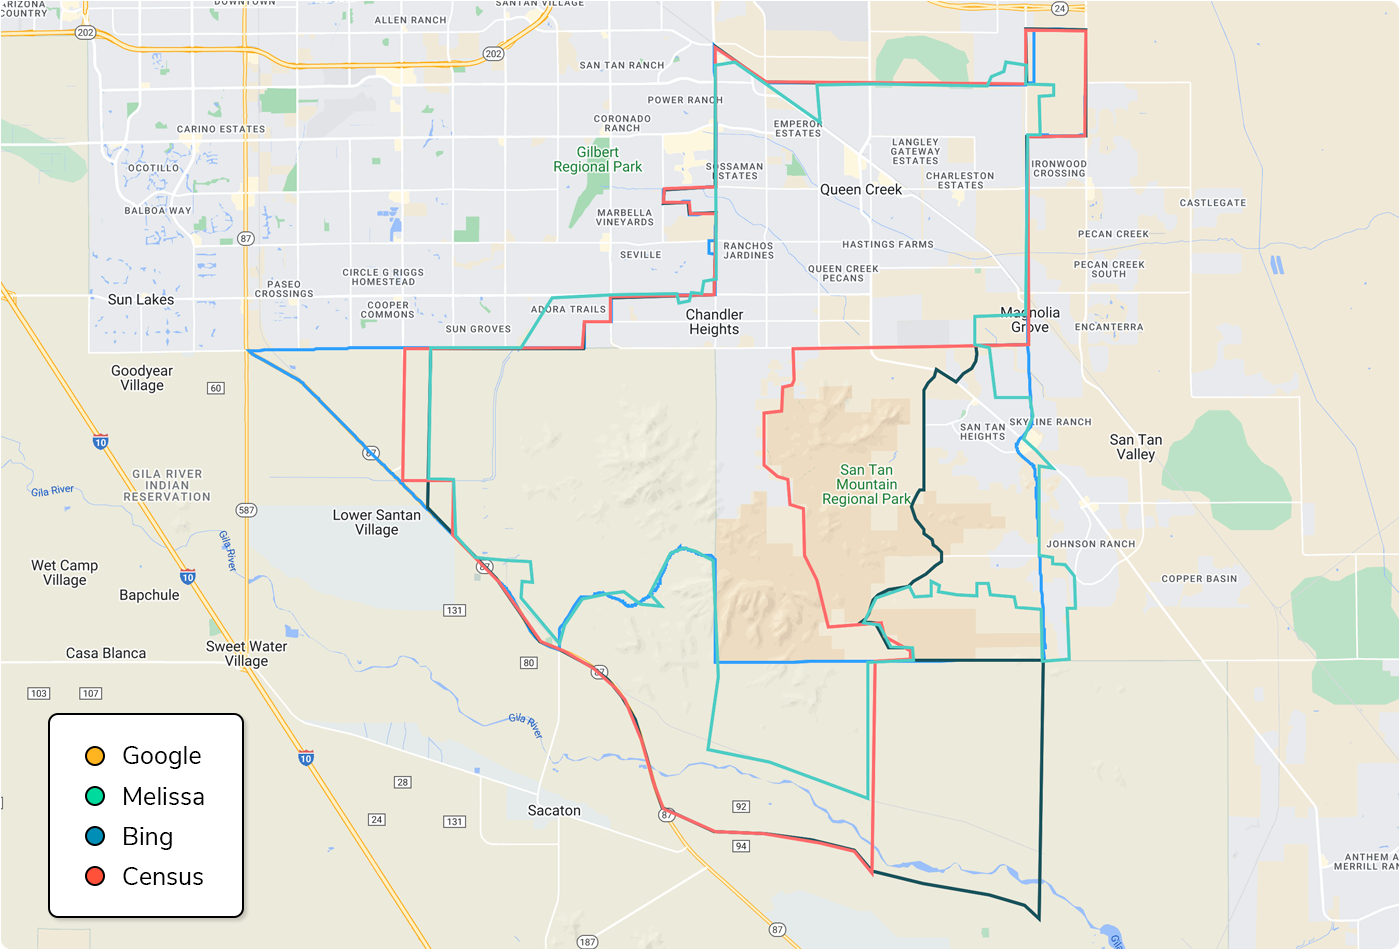
Zip Codes don't have one true source and can't be clearly delineated as the exact boundary. The census releases a “ZCTA”, while others release their boundaries using geocoded addresses and other sources deemed reliable.
Notice how the 85142 boundary changes from different providers? It's difficult to have confidence in your demographics if the reporting boundary is constantly changing between separate data providers and from year to year. When we analyze a location using a radius ring, drive time, or custom polygon, those boundaries are static and won't change. That allows one to examine how a location has evolved over time.
Visually we can see a pretty big difference in land area and neighborhood coverage from the separate boundaries. Ranging from 90 sq mi to over 116 sq mi the difference in neighborhoods contained vary greatly. Further examining the demographics of these 4 polygons using our current AGS estimates & projections, is where you see even more variation. Population ranges from 62,000 to 89,000, and households from 18,000 to 26,000. If you're researching numbers for a proposed location, or looking at existing store performance, having (or not having) an extra 27,000 residents or 8,000 homes is huge!
| Melissa | Bing | Census | ||
|---|---|---|---|---|
| Population | 89,062 | 62,250 | 63,345 | 86,890 |
| Households | 26,257 | 18,145 | 18,514 | 25,915 |
| Income | $151,095 | $168,422 | $167,139 | $147,232 |
| Businesses | 2,102 | 1,832 | 1,915 | 2,180 |
So we now know maybe the volatility and lack of standardization for Zip Codes make them a shady choice for analyzing areas. Confirming what the earlier article states, Zip Codes don't represent 'real' boundaries and they also don't depict how the residents inside them behave, spend, or travel. So what other options do we have? Well first off, using a static area of interest, like a radius ring or custom polygon, works for comparing year to year. REGIS Online uses the Census-defined Block Groups & Blocks for demographic mapping and reporting, so you'll get an apples to apples comparison.
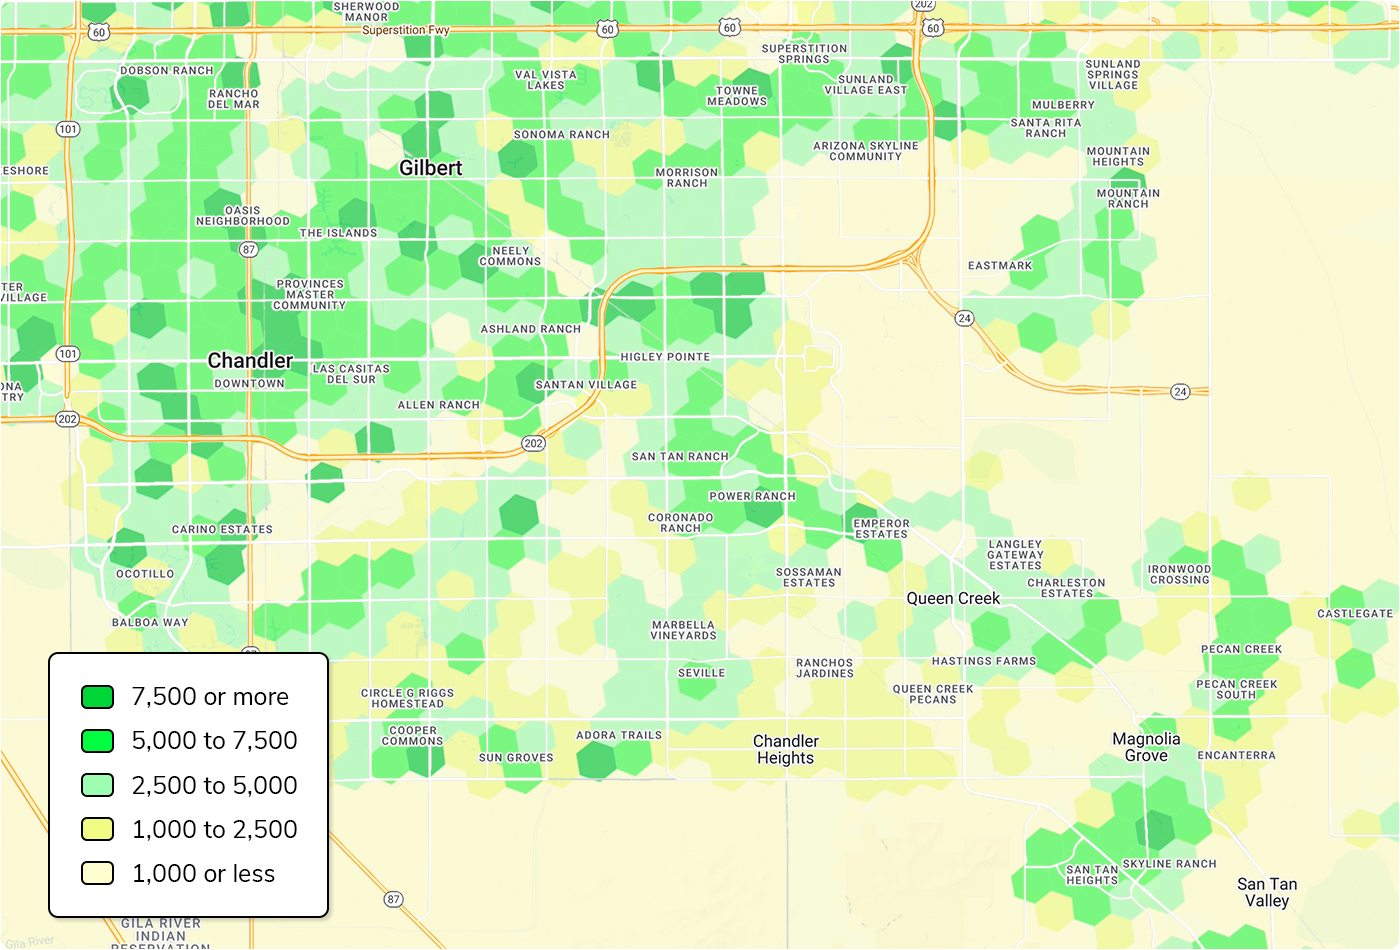
A newer spatial boundary that is great for comparison is the H3 hexagons from Uber, because all hexagons are laid evenly across the globe at different resolutions, similar to a grid, it allows for a boundary in Phoenix to be compared to Miami. Lastly, if you have customer address data you'd like to study, simply import the data as a layer into REGIS Online and then you can get counts and select those customers that fall into certain boundaries, like a polygon or radius. Happy mapping! •
Last Modified June 16, 2023


