Demographic map showing household data

Demographic Mapping

Discover Trends Within A Market With A Demographic Map

Create amazing maps with the data you want. With hundreds of demographic variables at your fingertips, our demographic mapping tools give you the ability to show where any type of demographic is in your market.

Choose from hundreds of demographic variables to add to your maps

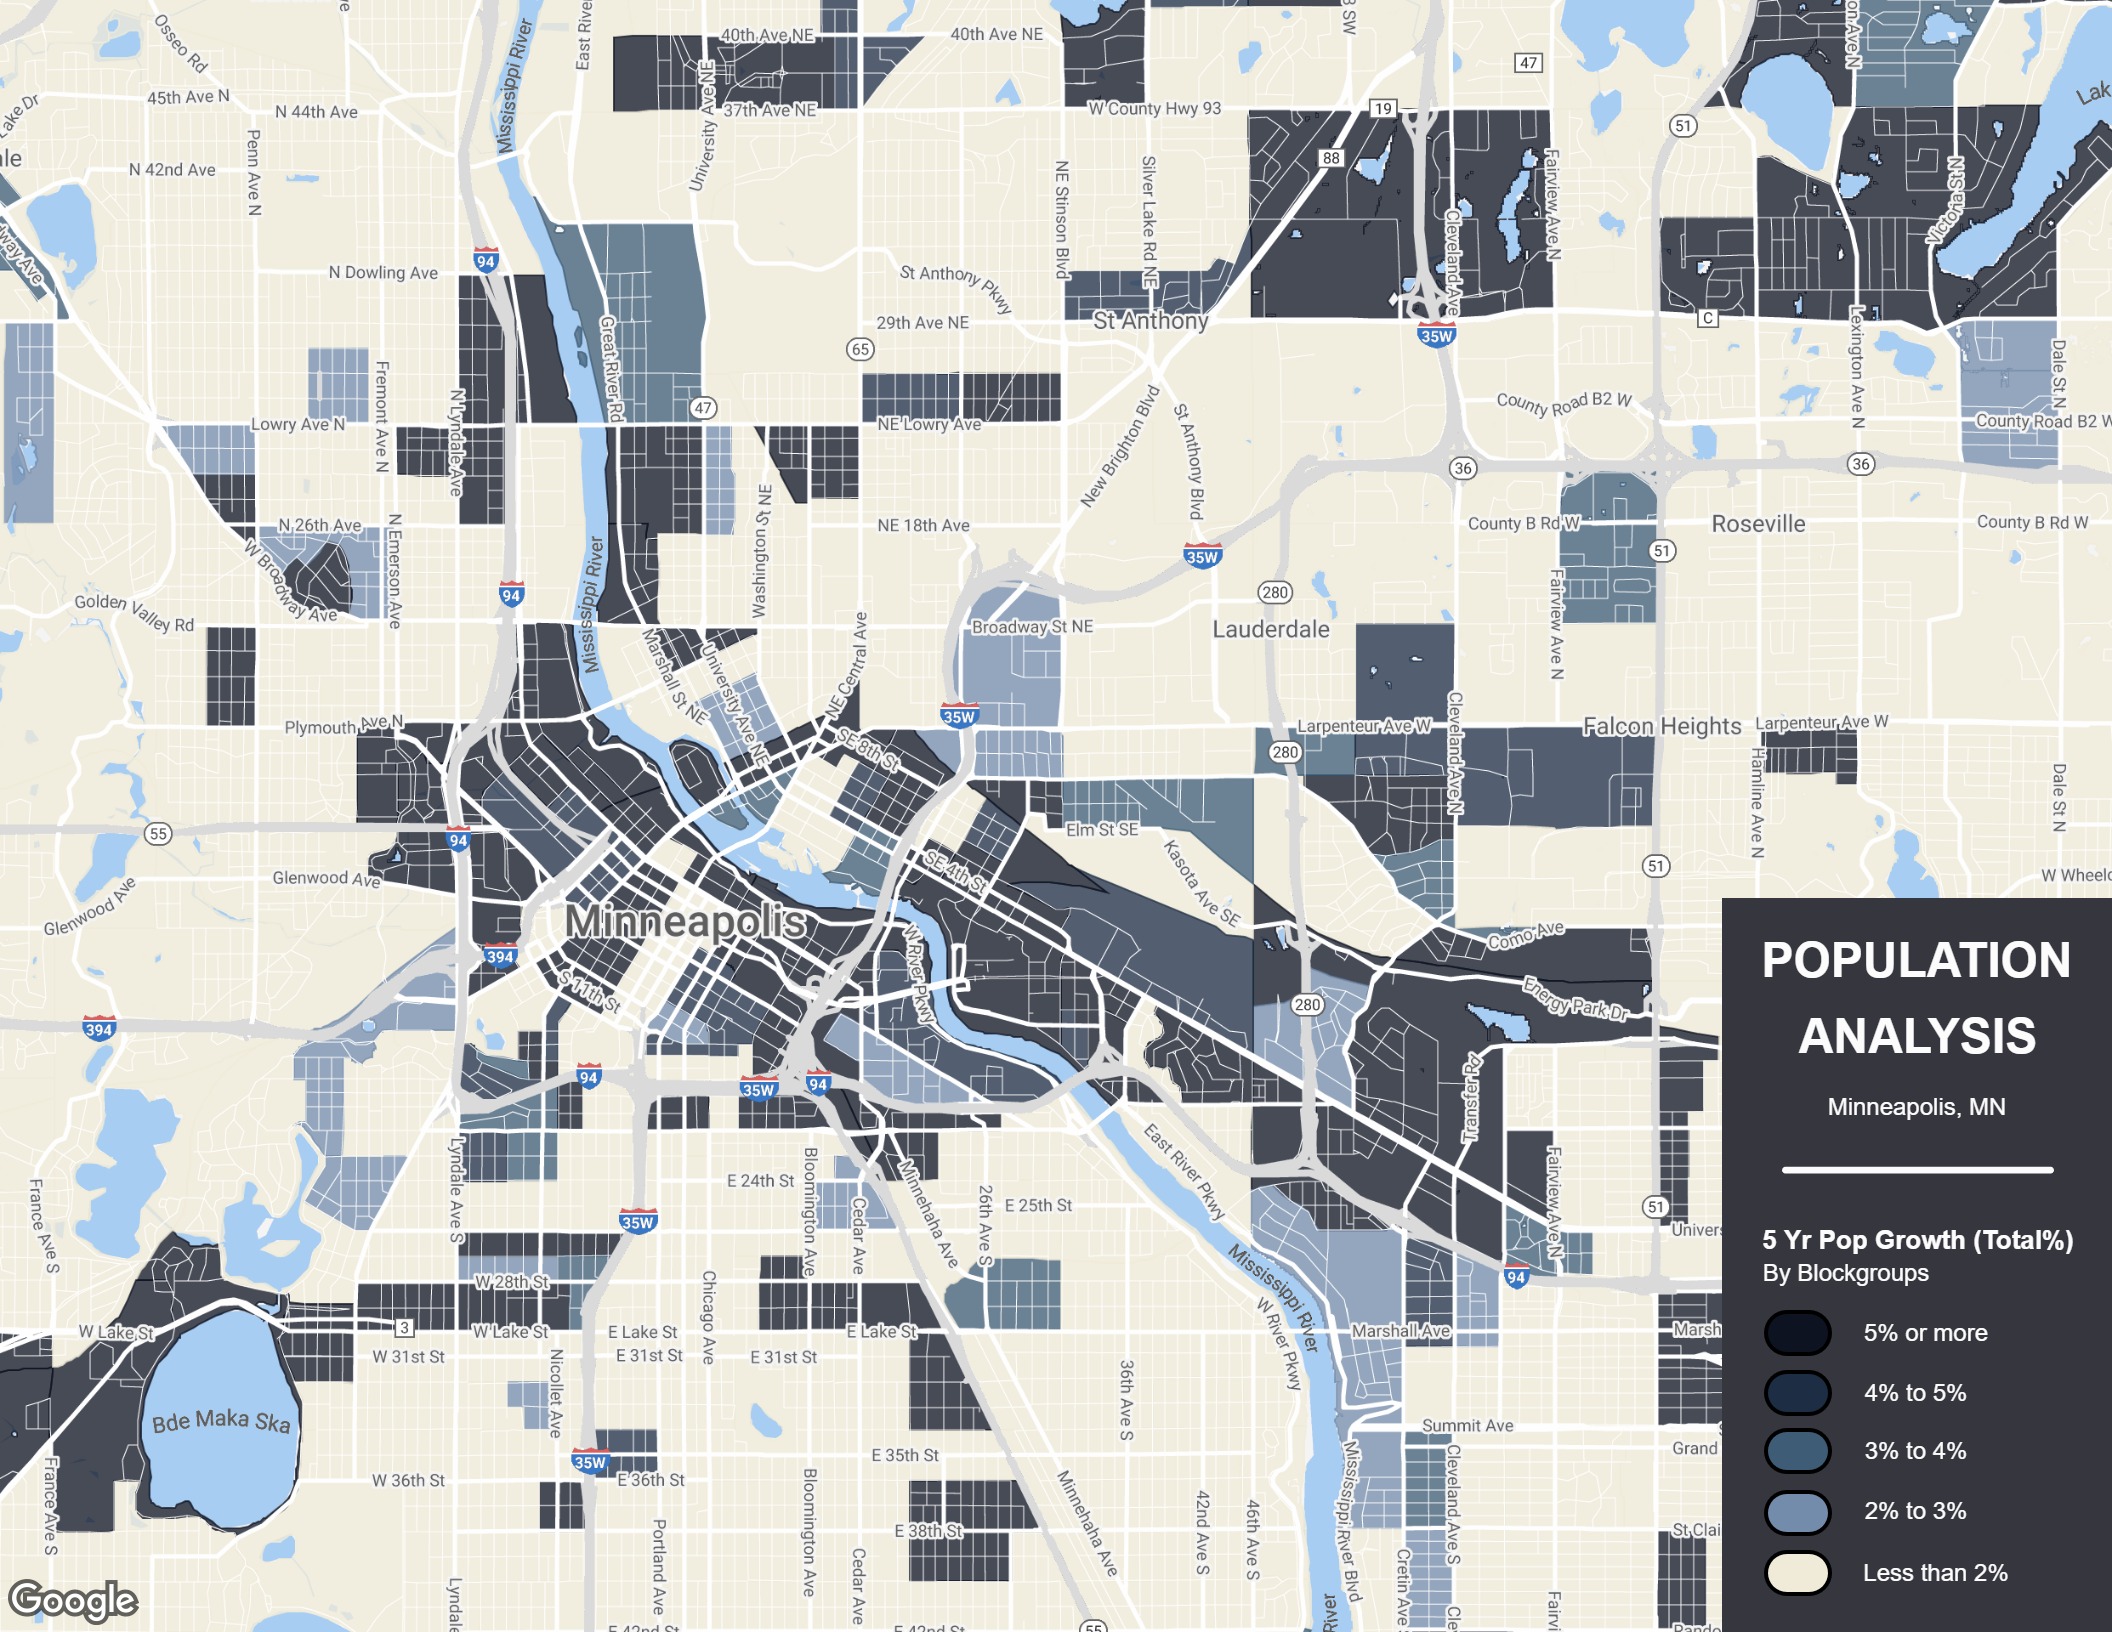
All The Demographic Data You Need

With REGIS Online, you can see data for hundreds of demographic variables with just a click. Choose from household income, population, education level, and hundreds of other options.

demographics by zip code on a map

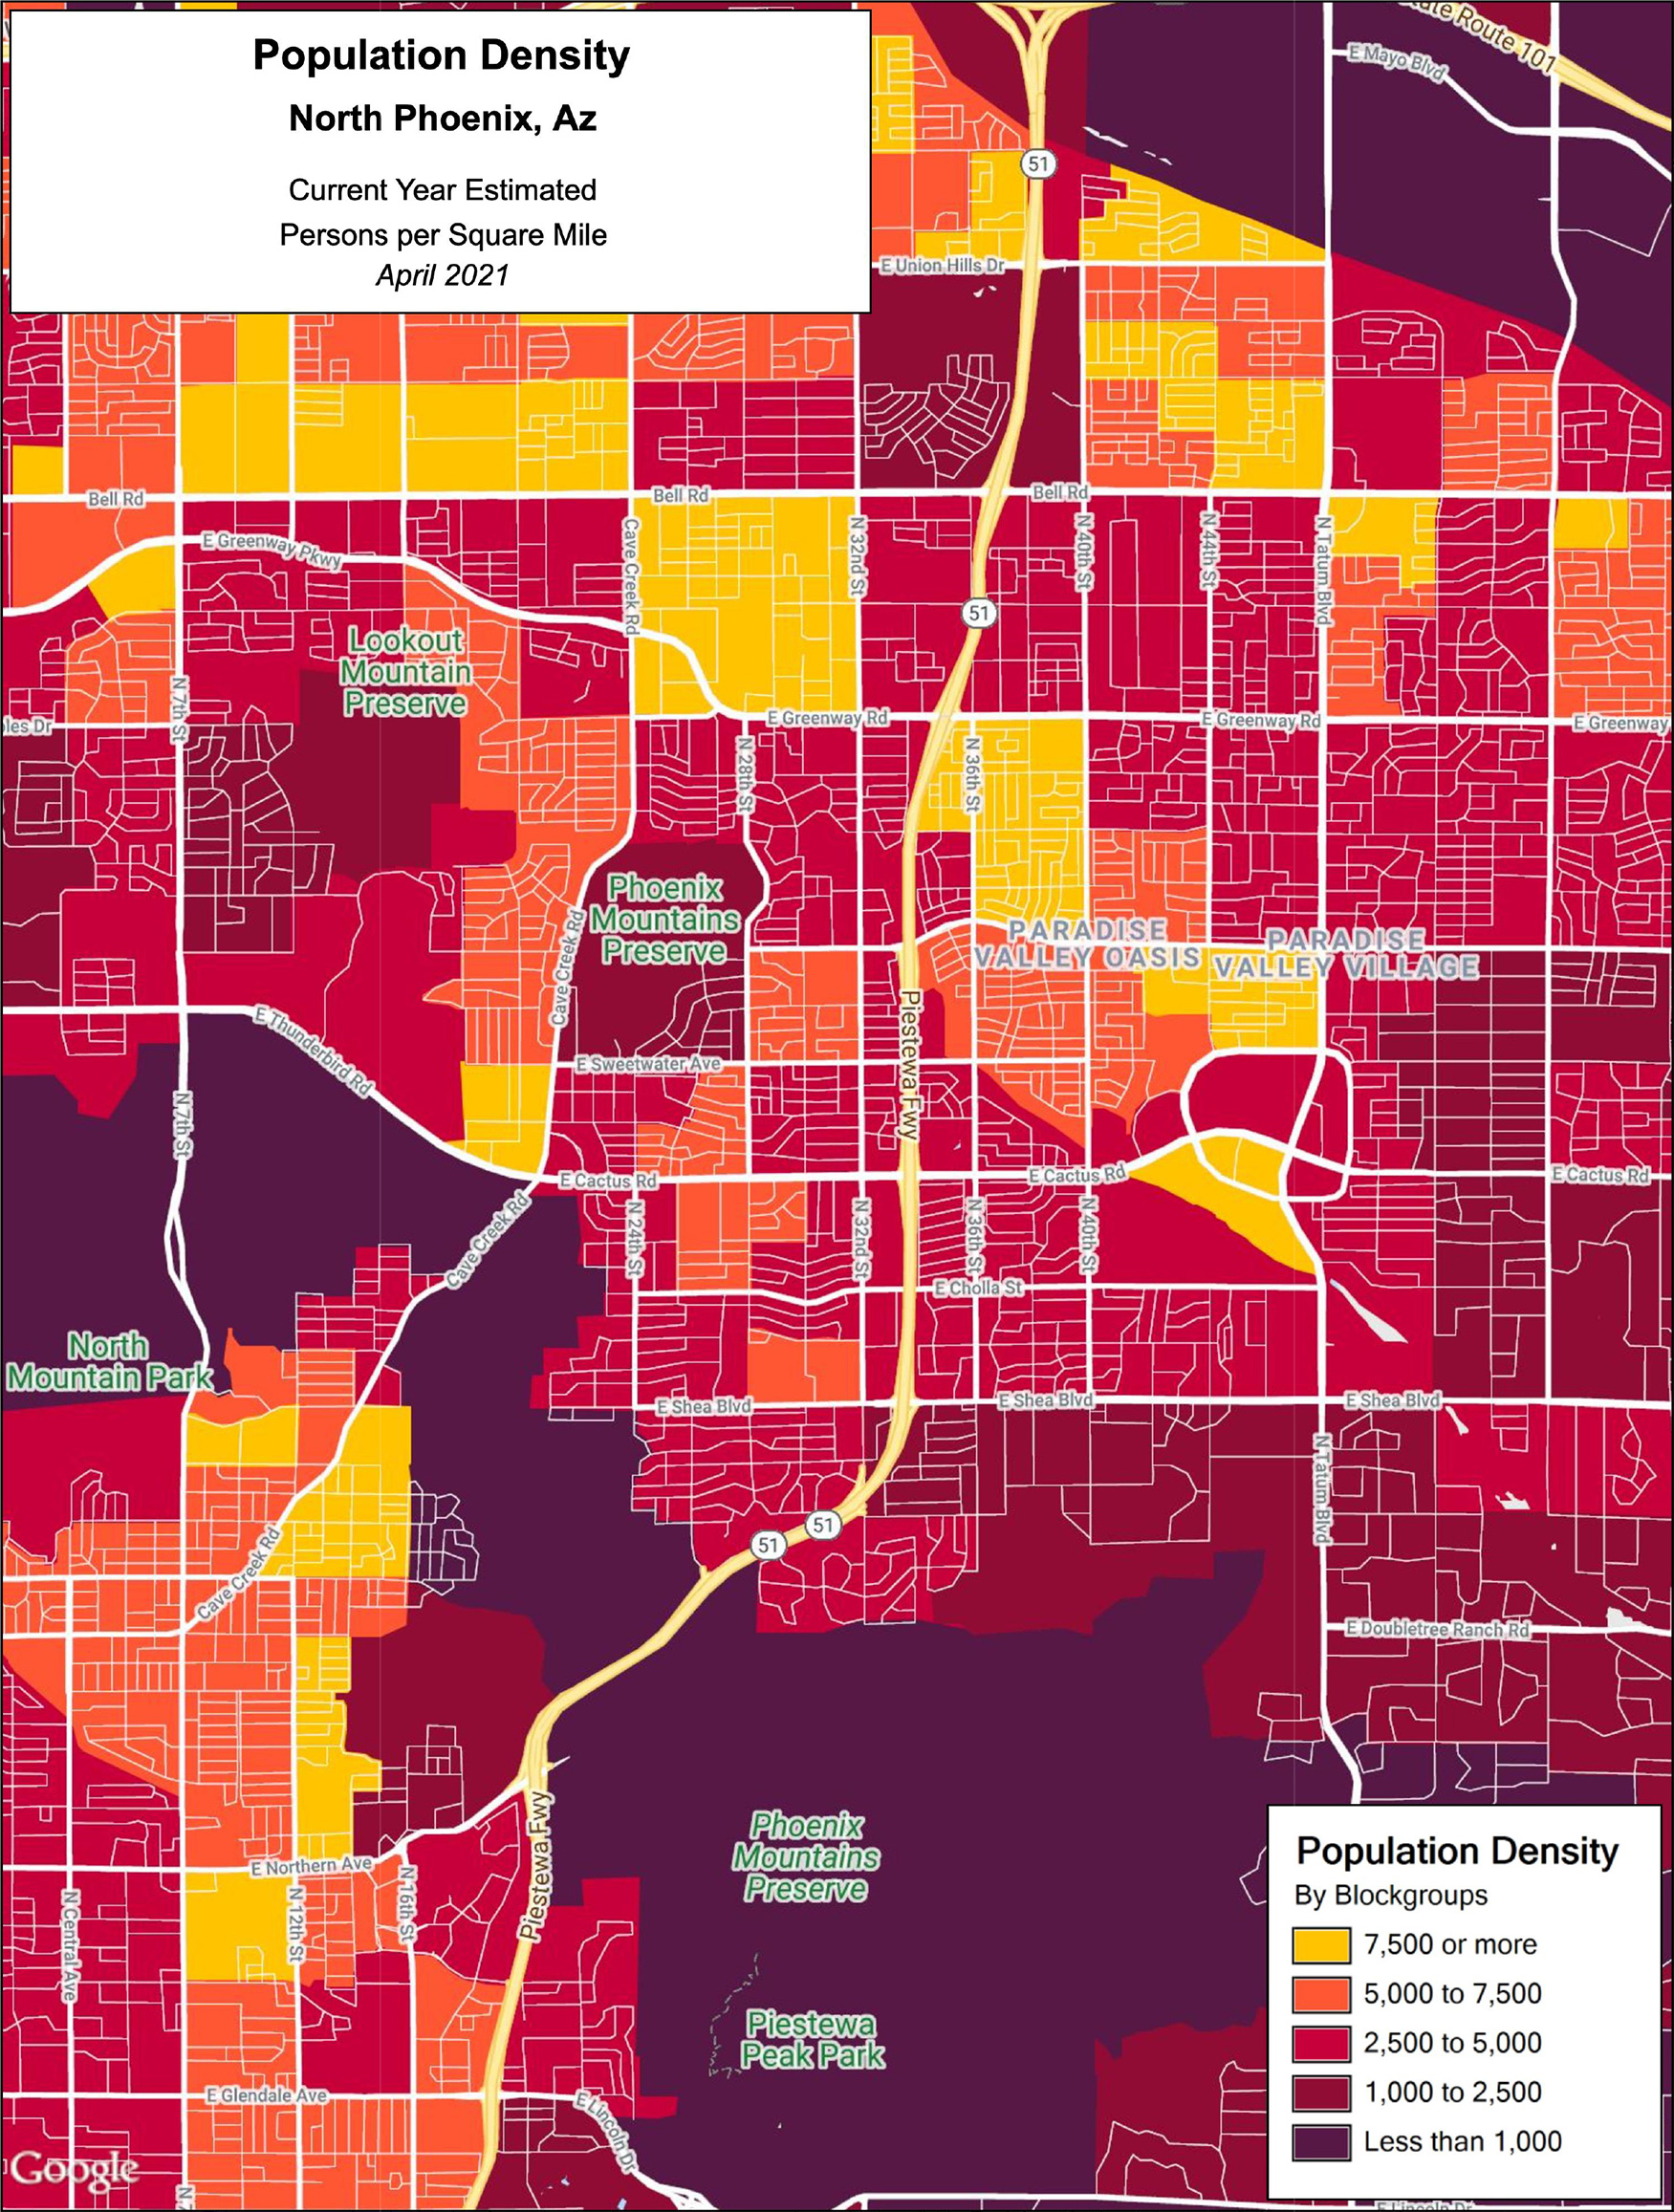
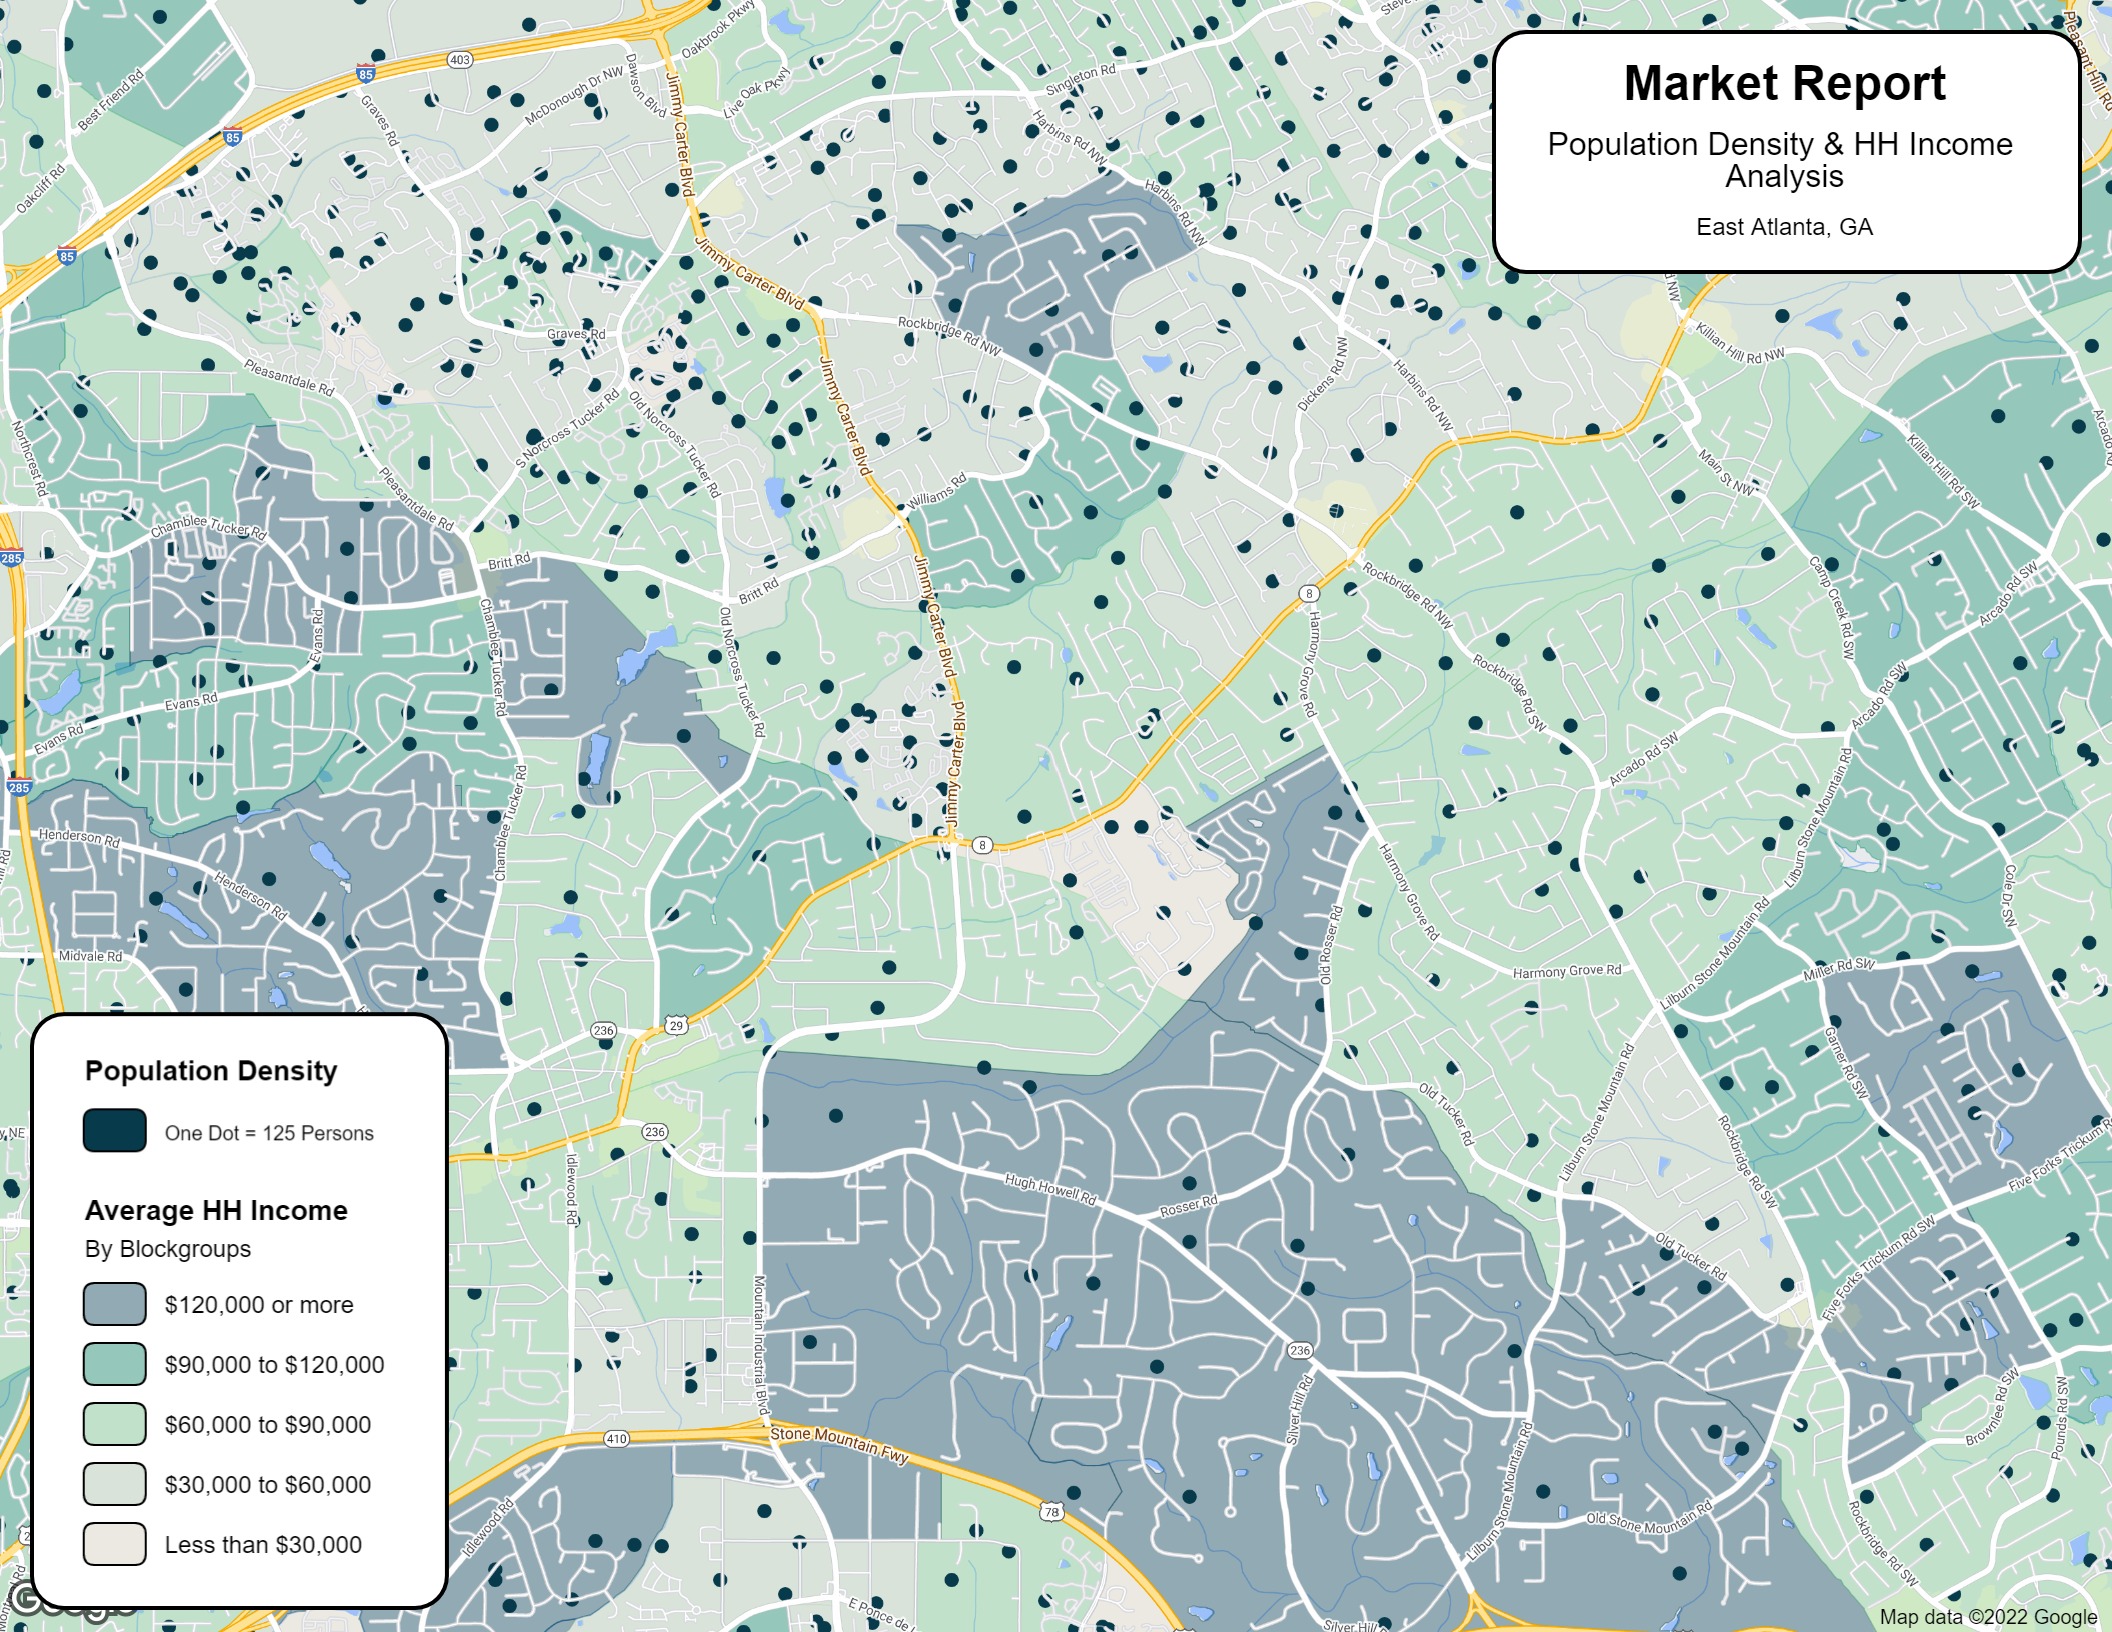
Precisely Analyze Your Target Audience

Add demographic data to your map so you can quickly visualize trends. Create a demographic map by zip code, custom trade area or a radius trade area to focus on target customers and demographic trends in your market.

Find multiple opportunities in your market with market optimization

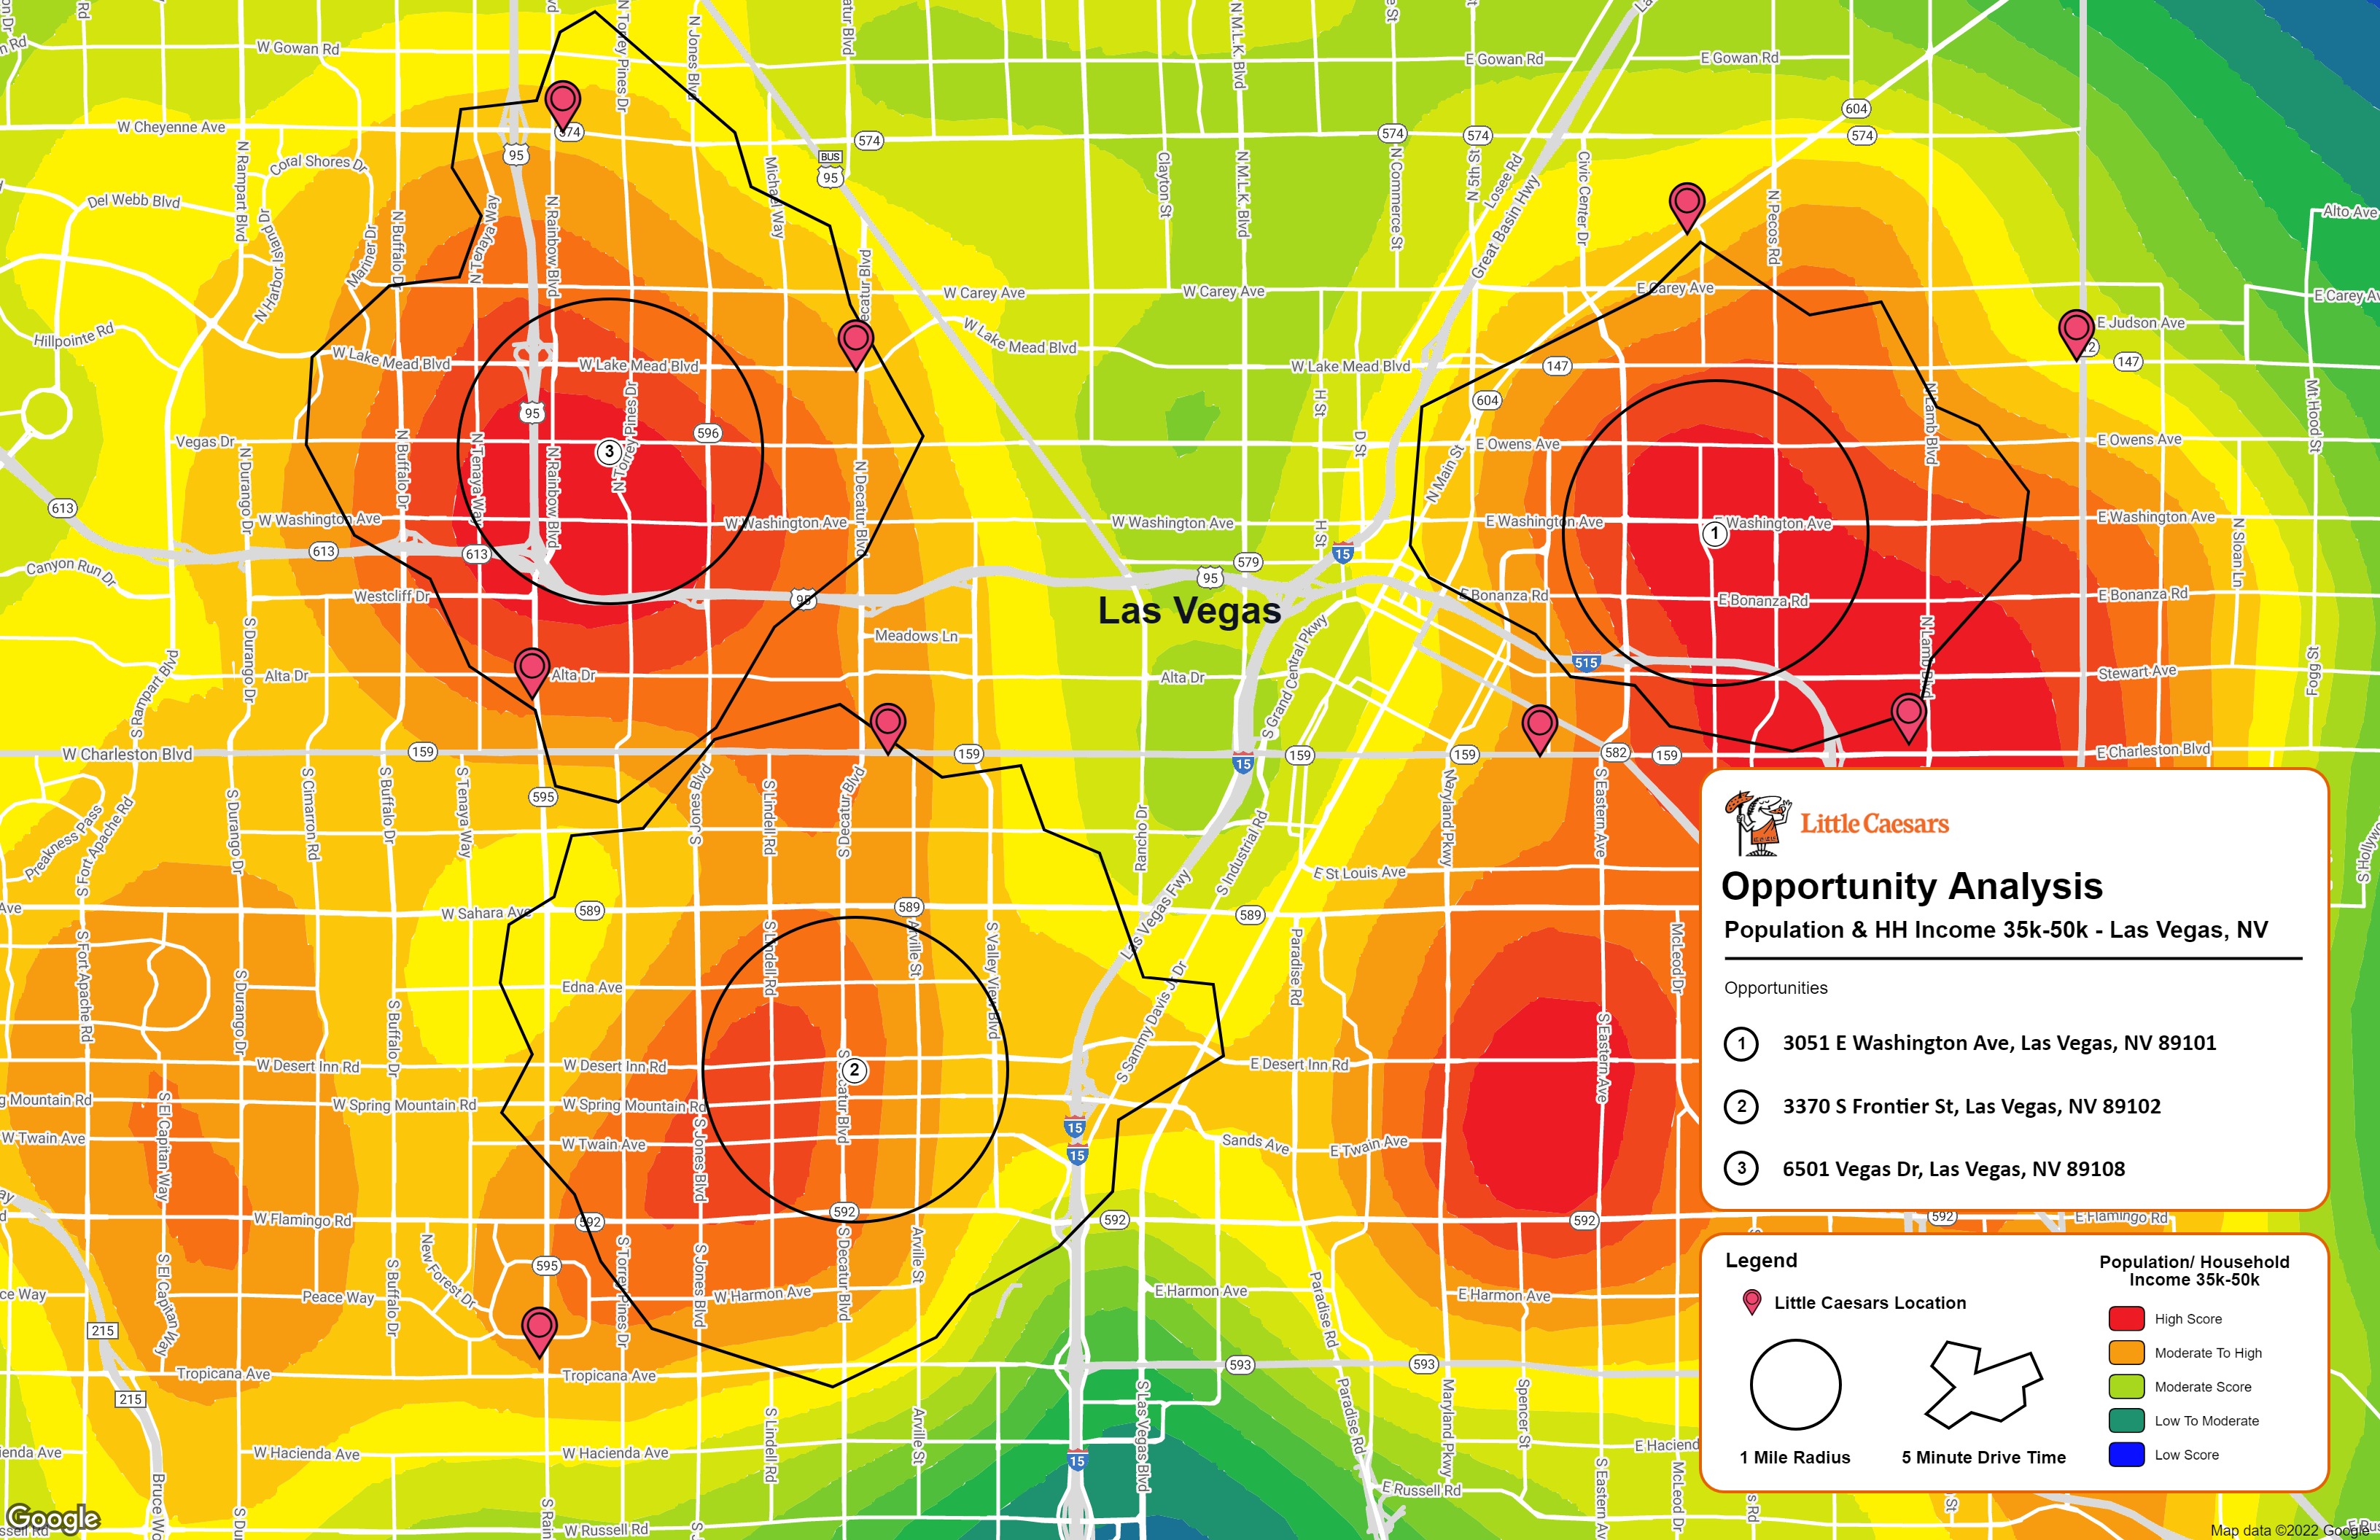
Map Multiple Demographics At Once

Combine up to four demographics to create a heat map. Automatically see up to the top ten ranked opportunities for expansion based on your demographics you select.

Create unlimited maps, anywhere in the nation

Unlimited Maps, Unlimited Locations

Get neighborhood demographics nationwide without worrying about limits with our demographic tools. Create as many maps and reports as you would like with REGIS Online.

View demographic data with a report, or data view

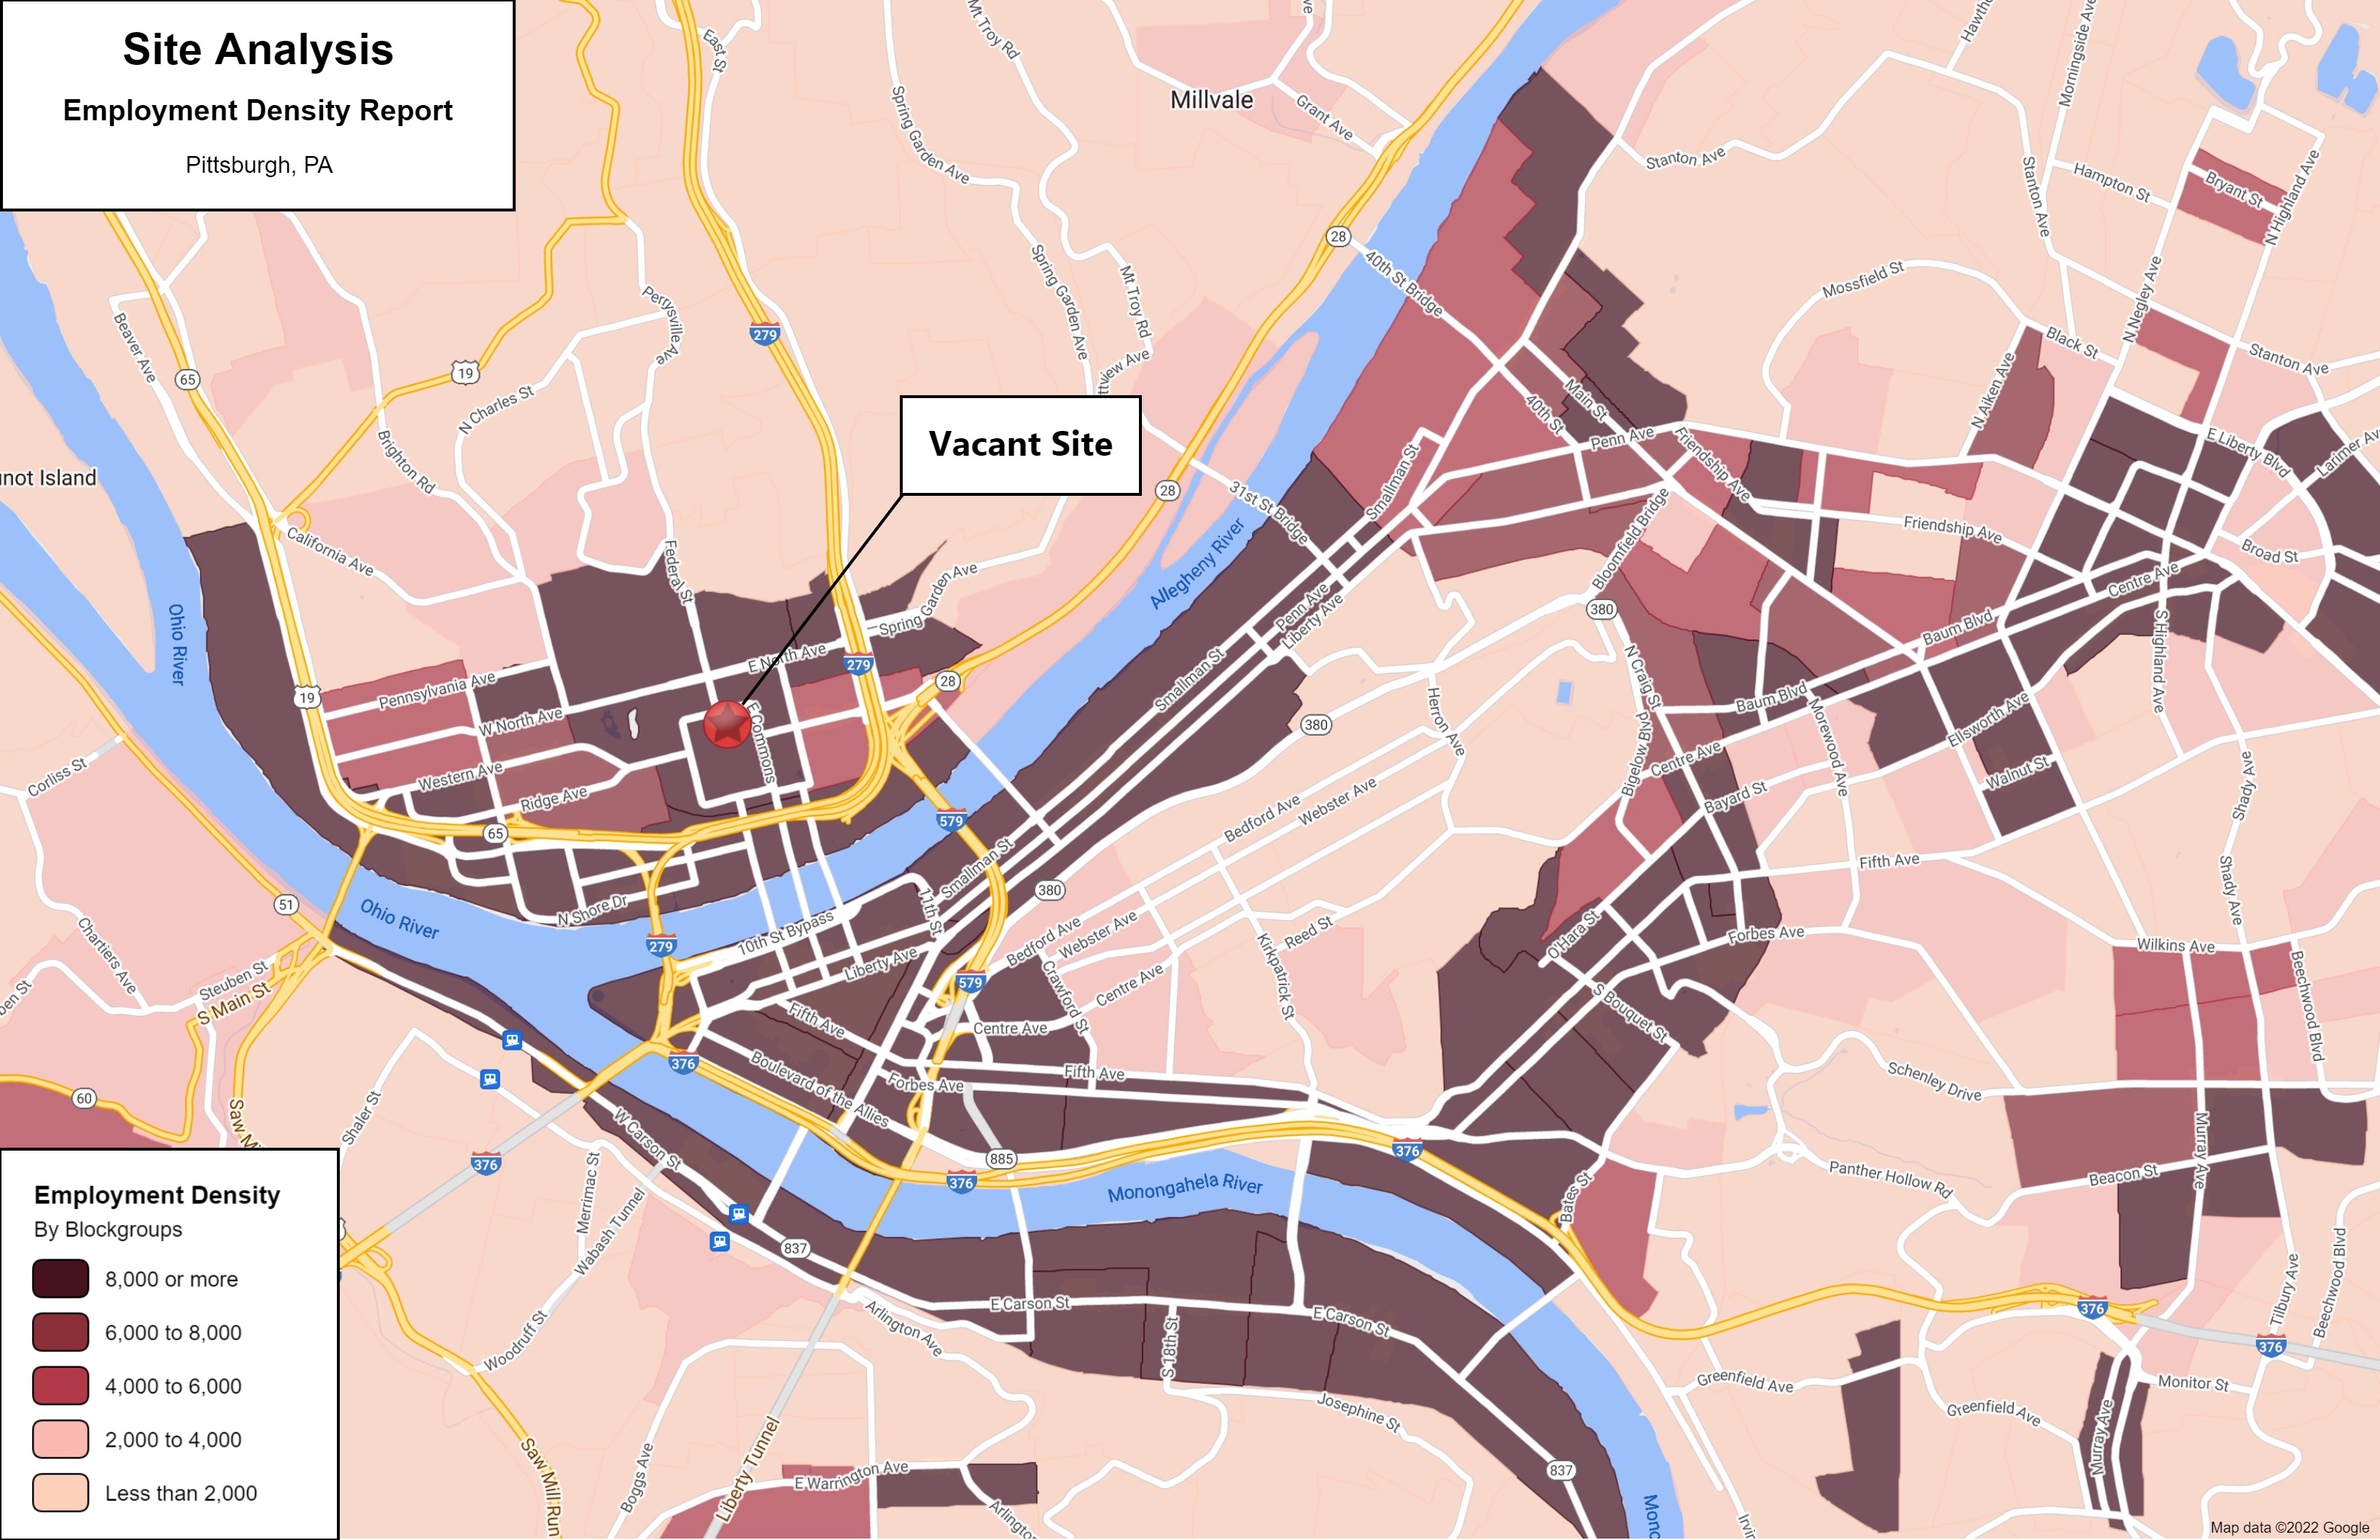
See Data The Way You Want

Run one of our industry standard demographic reports for a detailed look at what is happening at your site. Compare up to four sites at once with Data View to see which sites are best.

More Than Demographic Data

See the whole picture with some of our other popular data right in REGIS Online!

retail icon

Show Competition

Don’t waste time adding retail locations by hand! REGIS Online includes hundreds of retailers that you can see with a click.

traffic count label icon

View Traffic Patterns

Show annual or detailed counts for road segments in any market for a better understanding of how people travel.

users icon

Discover Your Real Customer

Understand the impact a center has on a market with mobile data. See customer origins with heatmaps or trade areas.

Take A Look

Sample of Market Opt toolSample of population density shading Sample of population growth shadingSample of employment density shadingSample of Dot Density toolSample of household income shading

This a market optimization map with areas with the highest density of population and income.

A demographic shading showing population densities.

A demographic shading showing where population growth is highest.

A demographic shading with employment density.

A dot density of population and shading of income.

An aerial map with an average income demographic shading.

By downloading these samples you agree to Sites USA's Terms.

REGIS Online is the best online gis program available

See How REGIS Online can help you

Let's connect and show what REGIS Online can do around one of your properties.