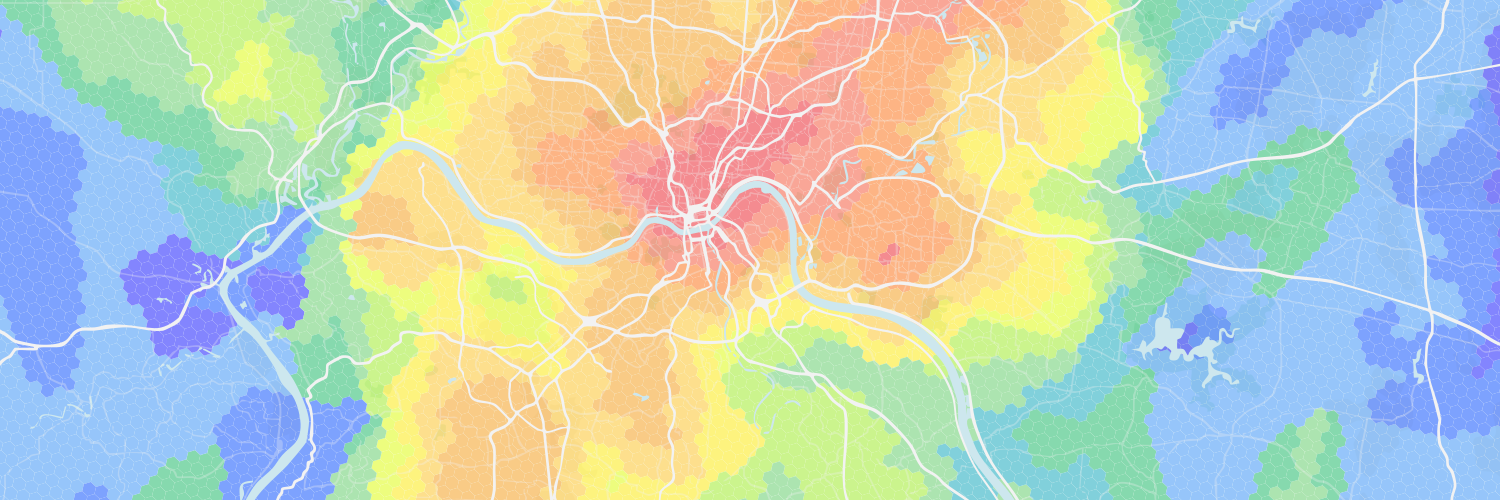
Heat Map Shading
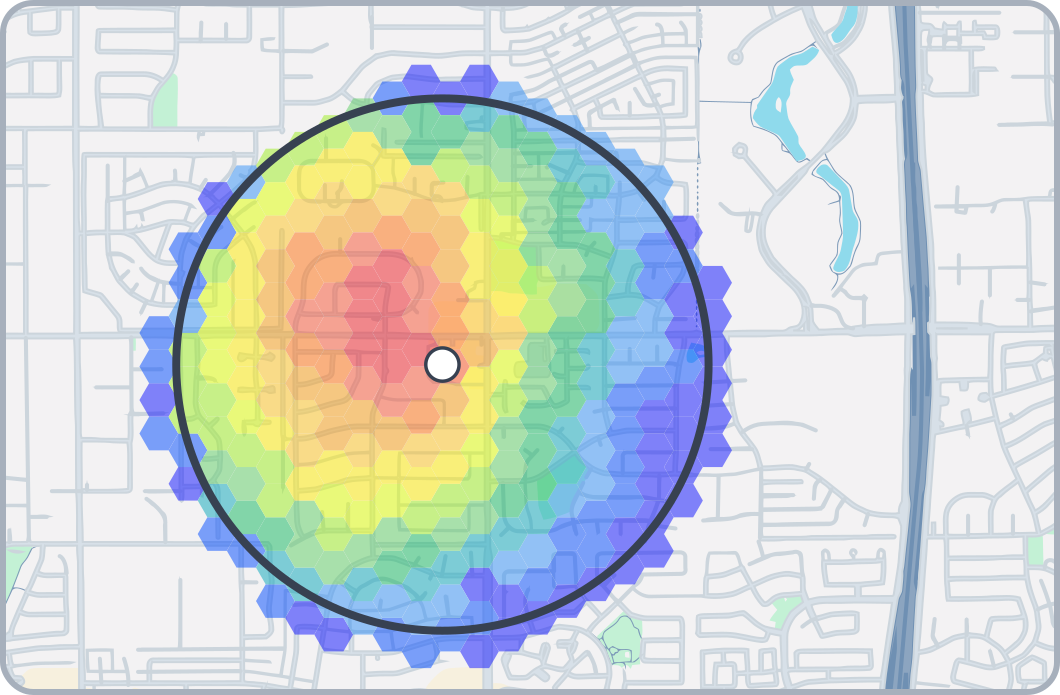
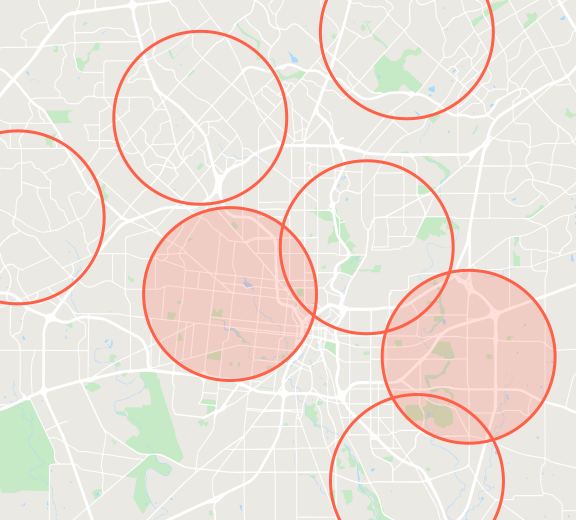
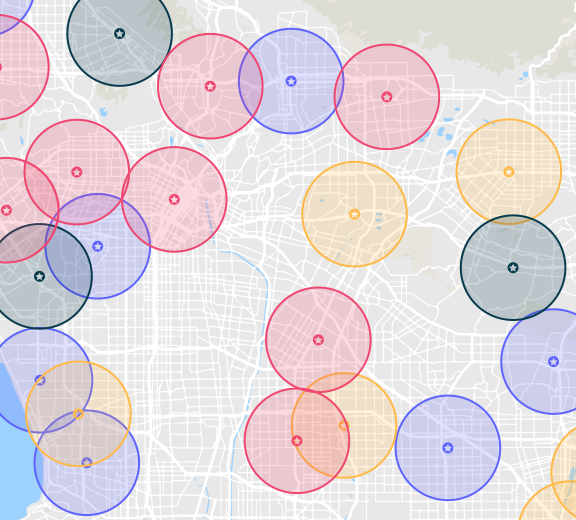
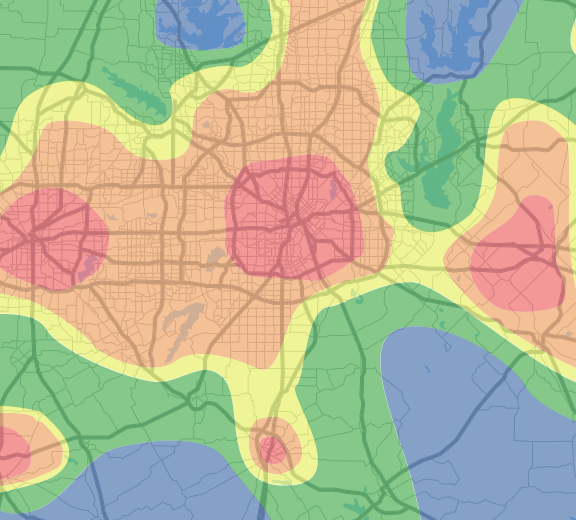
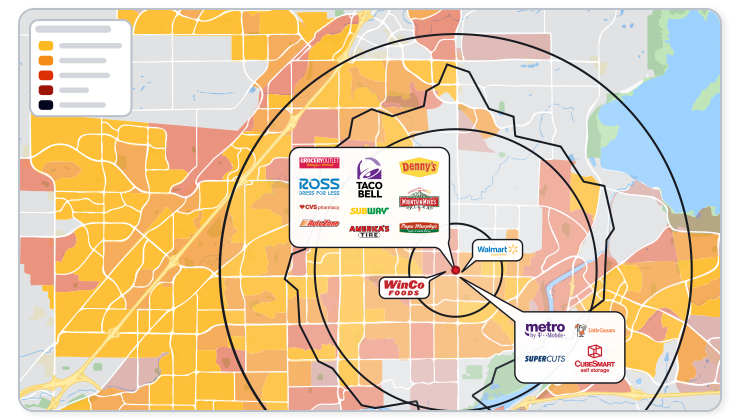
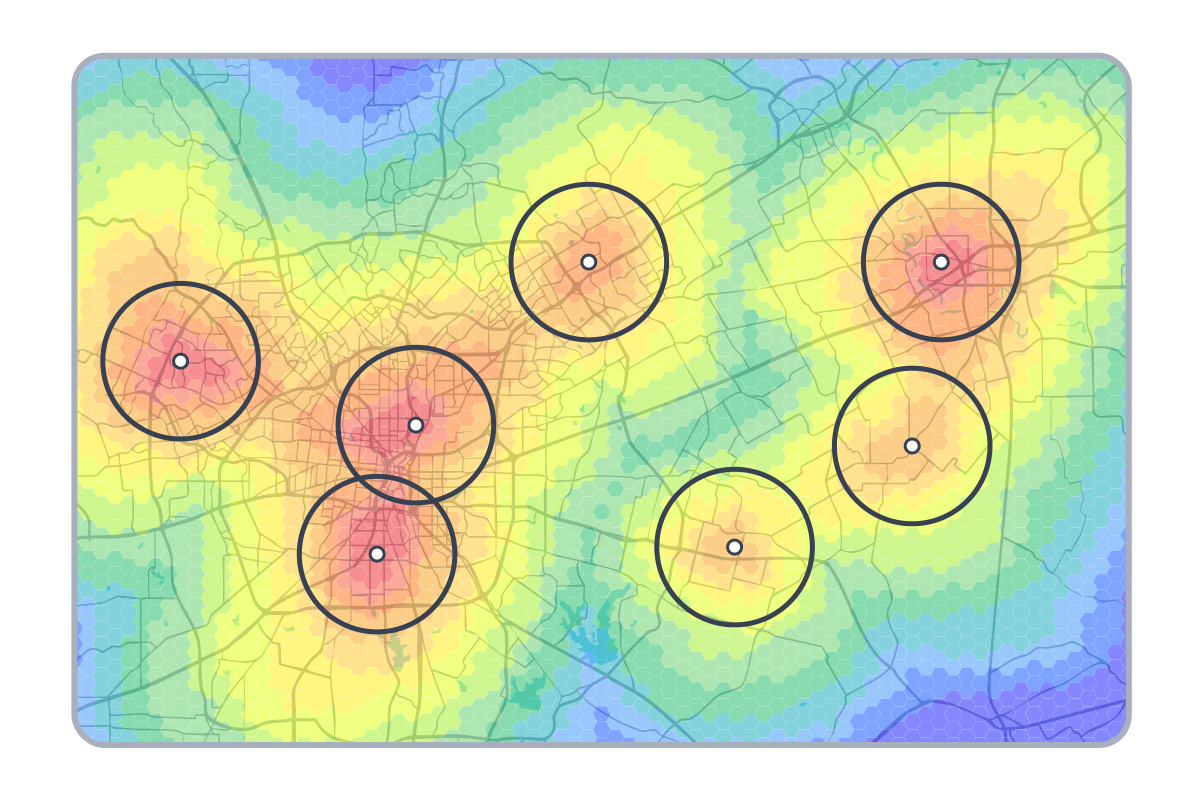
See opportunities come to life in an instant with the heat map shading. The H3 grid highlights hot and cold spots across your market, helping you zero in on the best areas for further research.
See Sample Maps
Professional Reports
Go beyond the map with professional, presentation-ready reports. Each Market Optimization report gives you a clear summary of how the study was set up, along with detailed data for every result.
See A Sample Report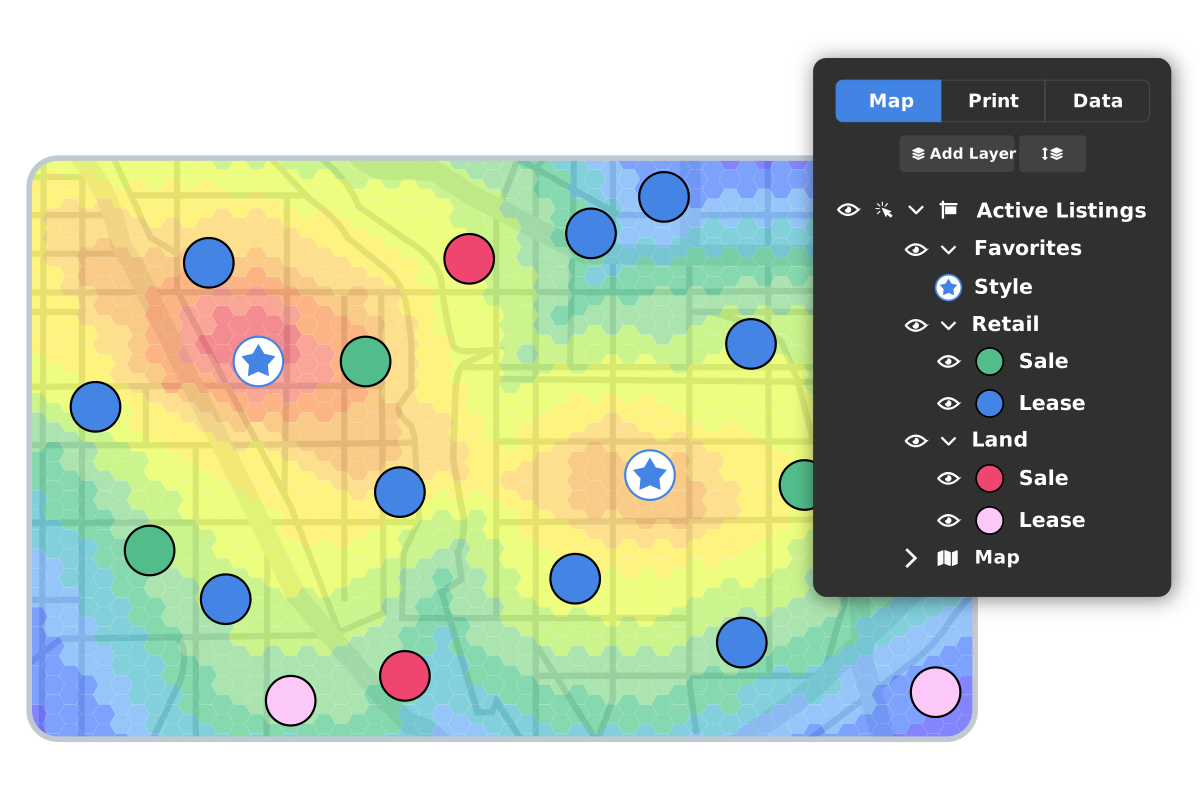
Move from Market Potential to Available Properties
Grade every site in your study against your demographic model, then see which top-ranked areas have real, available properties with our Active Listings integration. Each listing is scored against your model, so you can go from market potential to a specific property without switching tools.
Learn More About Active Listings