How To Find Sites For An Expanding Retailer
A Guide On The Retail Site Selection Process
By Demi Newell
Published November 17, 2026
By Demi Newell
Published November 17, 2026
Drive-thru coffee is a category in retail that is constantly expanding. Their adaptable format, fast payback, lower startup costs, and products that are always in demand allows them to easily replicate their success and open more locations. Black Rock Coffee Bar is one of these growing retailers and announced this year that they're targeting 1,000 stores by 2035. Using GIS data and a CRE mapping software, we'll show you how to find a retailer's next location.
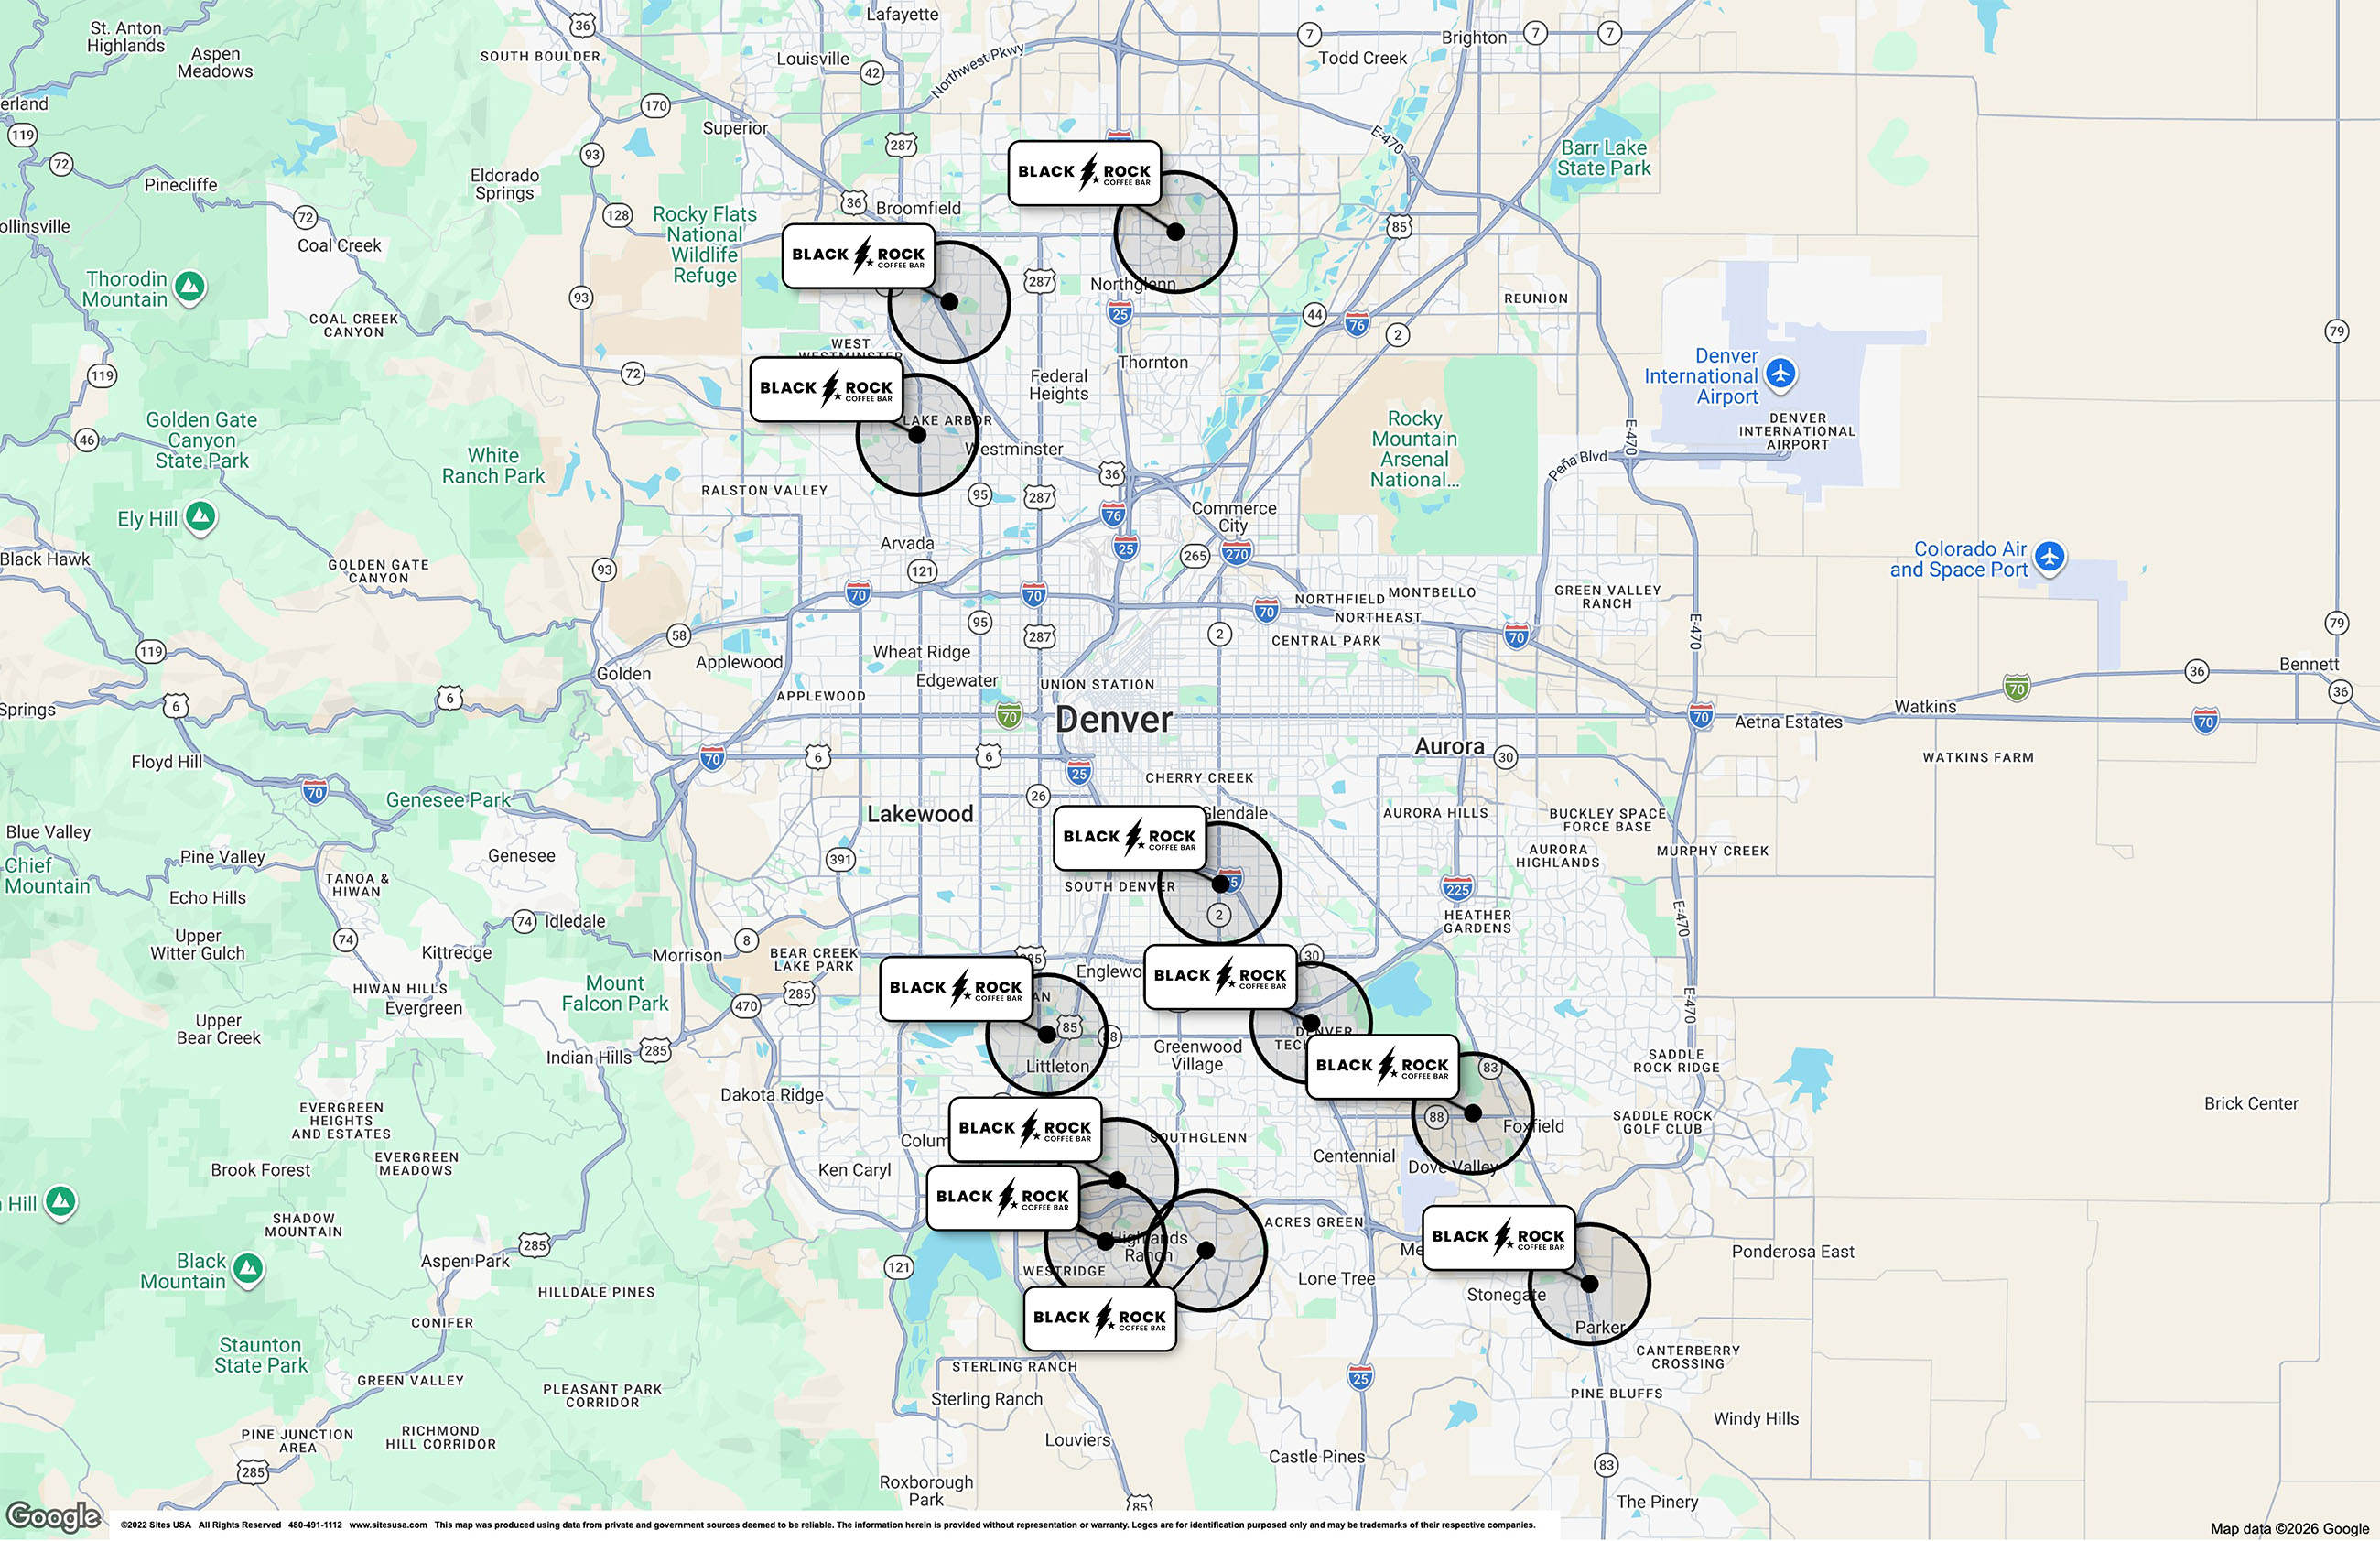
Black Rock stated their strategy is to grow a stronger presence in existing markets which are currently Arizona, California, Colorado, Idaho, Oregon and Texas. Using REGIS Online's merchant database and a list of upcoming stores, we're able to map out all of the Black Rock locations in the United States. After comparing each market, we noticed potential pockets in the Denver, Colorado market and will do further research to see how viable these areas actually are.
First, we'll need to map out all the Black Rock locations in the Denver area and add trade areas to our sites. We noticed the majority of their current stores have at least a 2 mile trade area before they start overlapping into each other's territory aside from the cluster near Highland Ranch.
Now that we've placed our sites and added trade areas, we'll need to determine what demographics and other traits our current stores have. Understanding your site criteria is crucial when expanding to ensure you're going somewhere that you'll succeed in.
You may already have an idea of who your target audience is but backing that information with data gives you a clearer picture of what to look for and validates your intuition. Site selection analysis depends on up-to-date and reliable data so that you can ensure your analysis is accurate. If you're sharing this information, you'll want easy to read reports that communicate your findings and make gathering data easy.
In our CRE mapping software, we have all our current Black Rock locations already mapped. Since we want to view all the demographics for all our locations, we can batch our reports or use demographic data fill and view all the data at the same time.
We'll stick with the typical demographics that most businesses rely on which are population, households, median household income, traffic counts, and common retailers found within their trade area.
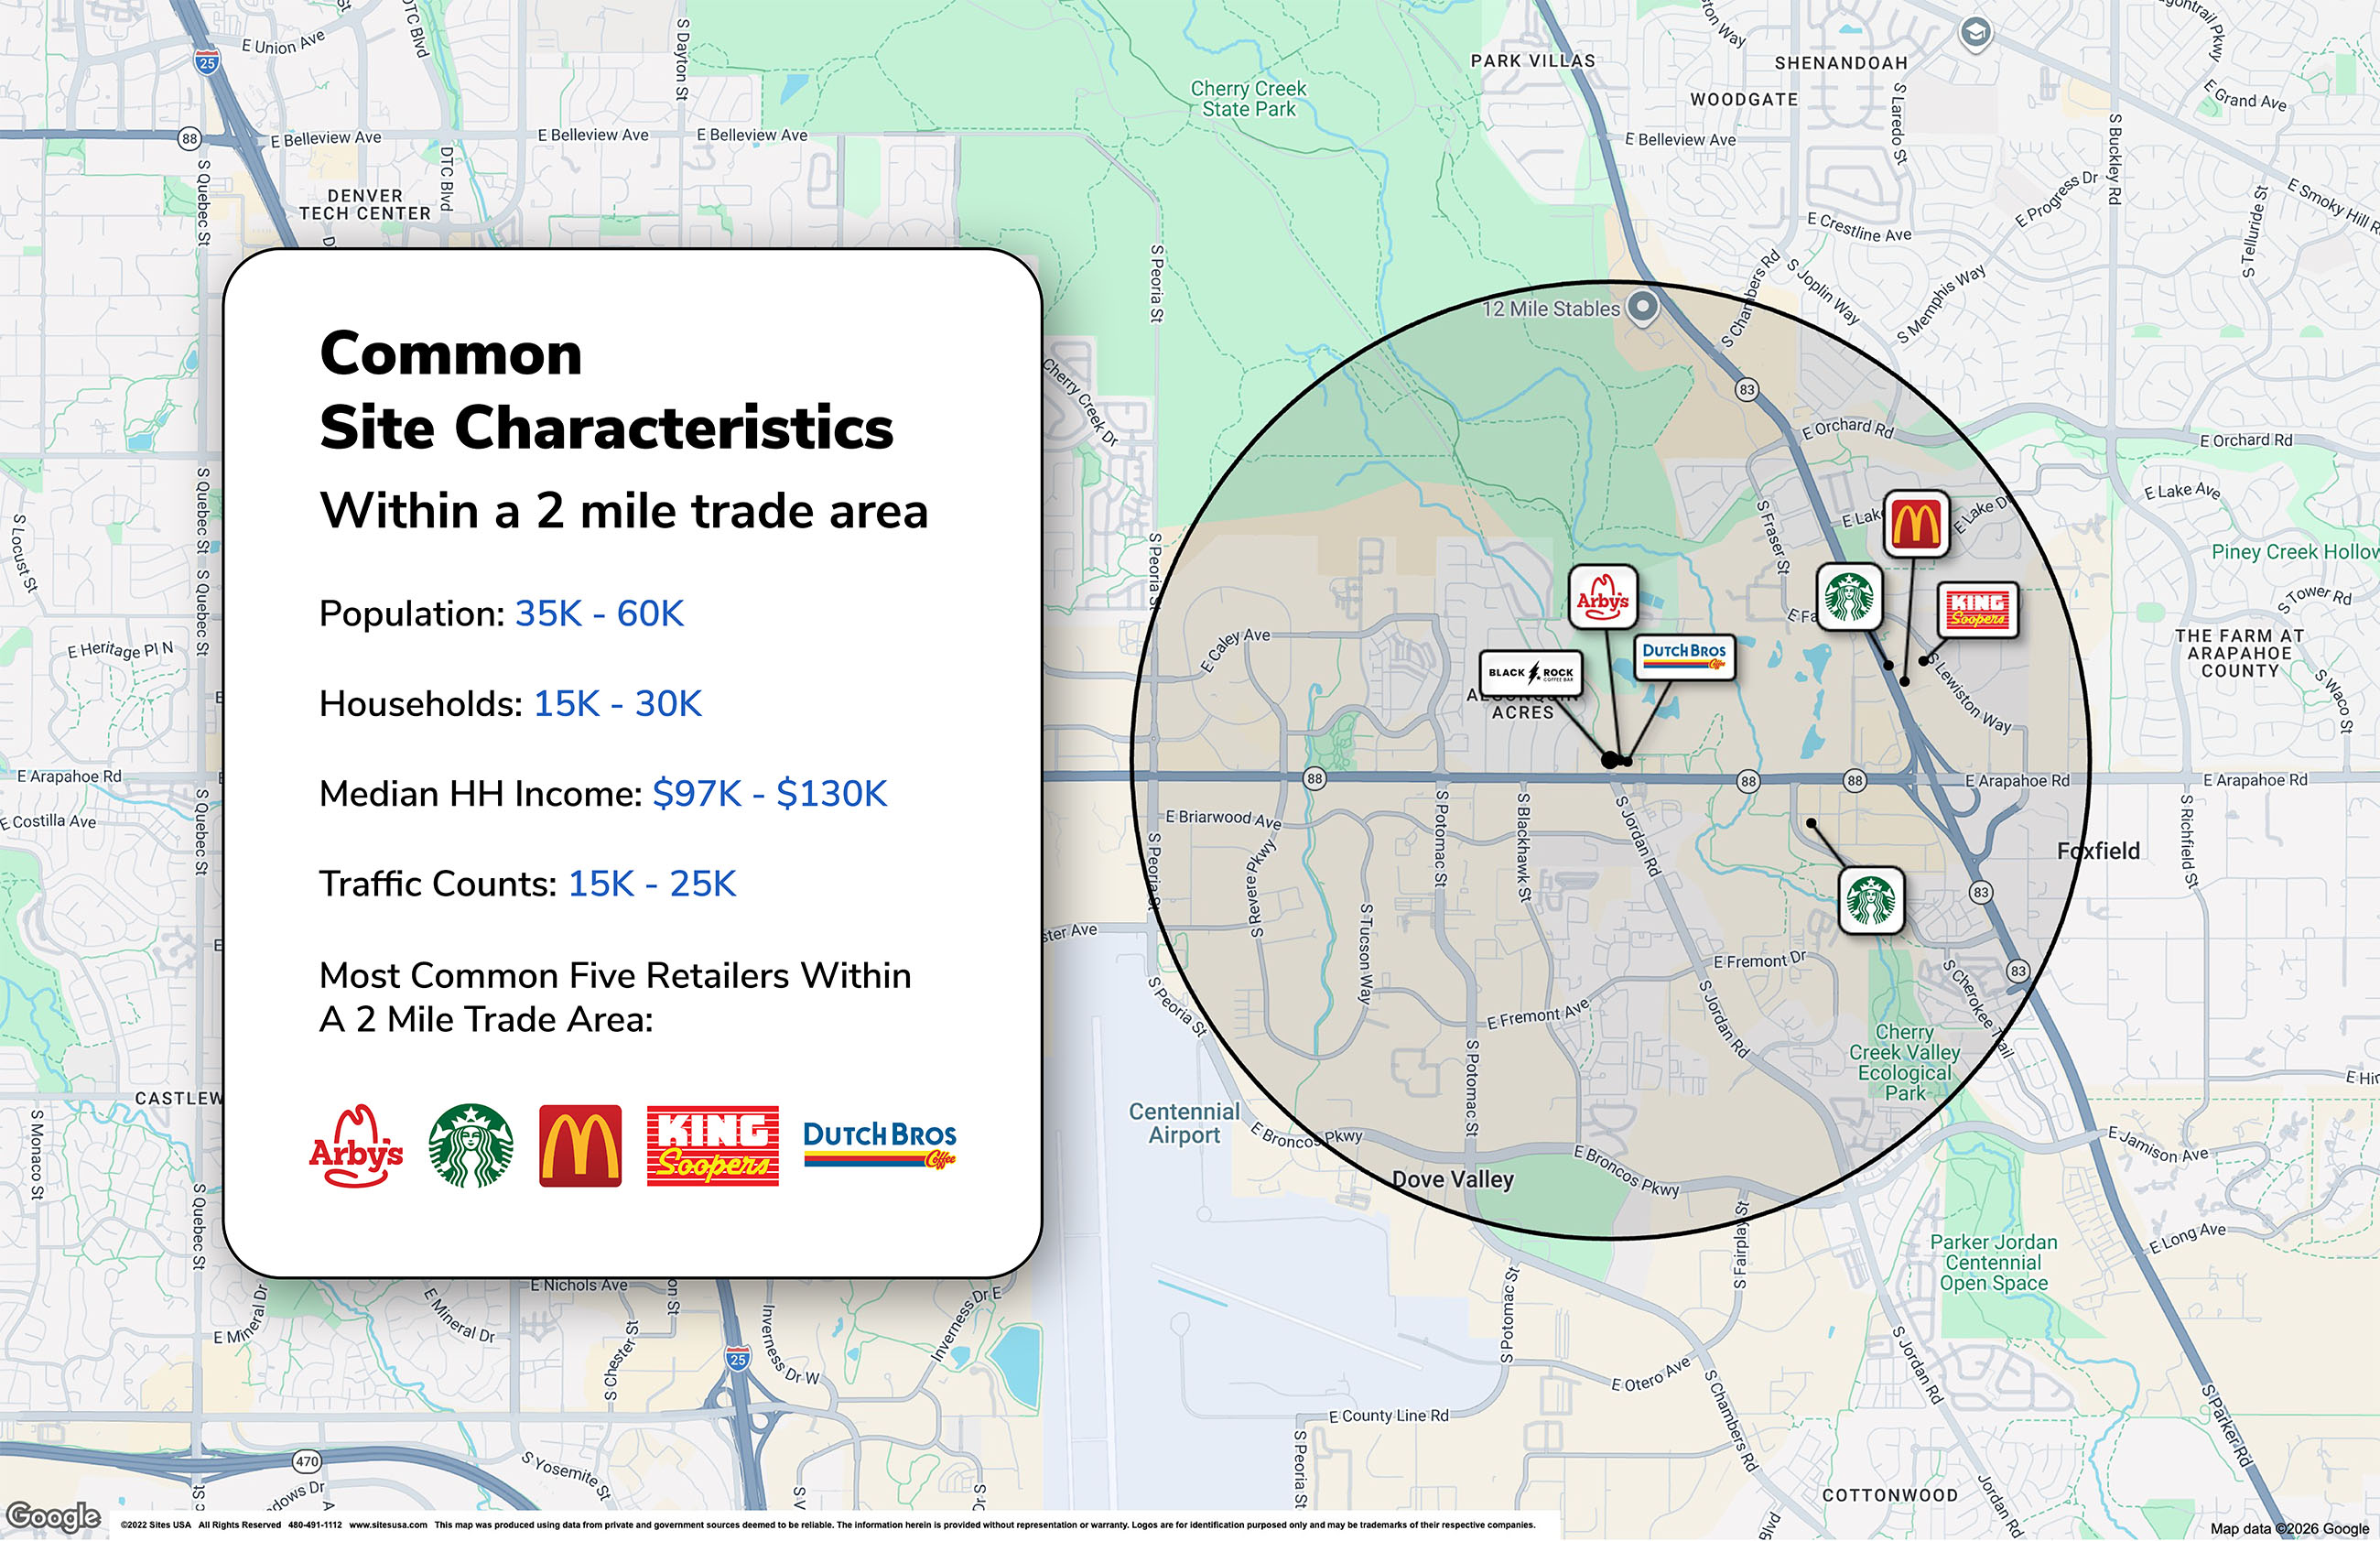
After getting the numbers, we found that the population ranges from 35K to 60K, households range from about 15K to 30K, median household income ranges from $97K to $130K, traffic counts range from 15K to 25K and their most common retailers were Arby's, Starbuck's, McDonald's, King Soopers and Dutch Bros. Next, we'll use these demographics as our site criteria for the next part in our site selection analysis.
| Characteristic | Value |
|---|---|
| Population | 35K - 60K |
| Households | 15K - 30K |
| Median Household Income | $97K - $130K |
| Traffic Counts | 15K - 25K |
| Most Common Co-Tenants | Arby's, Starbucks, McDonald's, King Soopers, Dutch Bros Coffee |
Market optimization is a tool in REGIS Online that helps you find the top locations in your market by showing you a visualization of hotspots in the area. The tool weighs important demographics of your choosing and can be layered with other data like traffic counts and merchants.
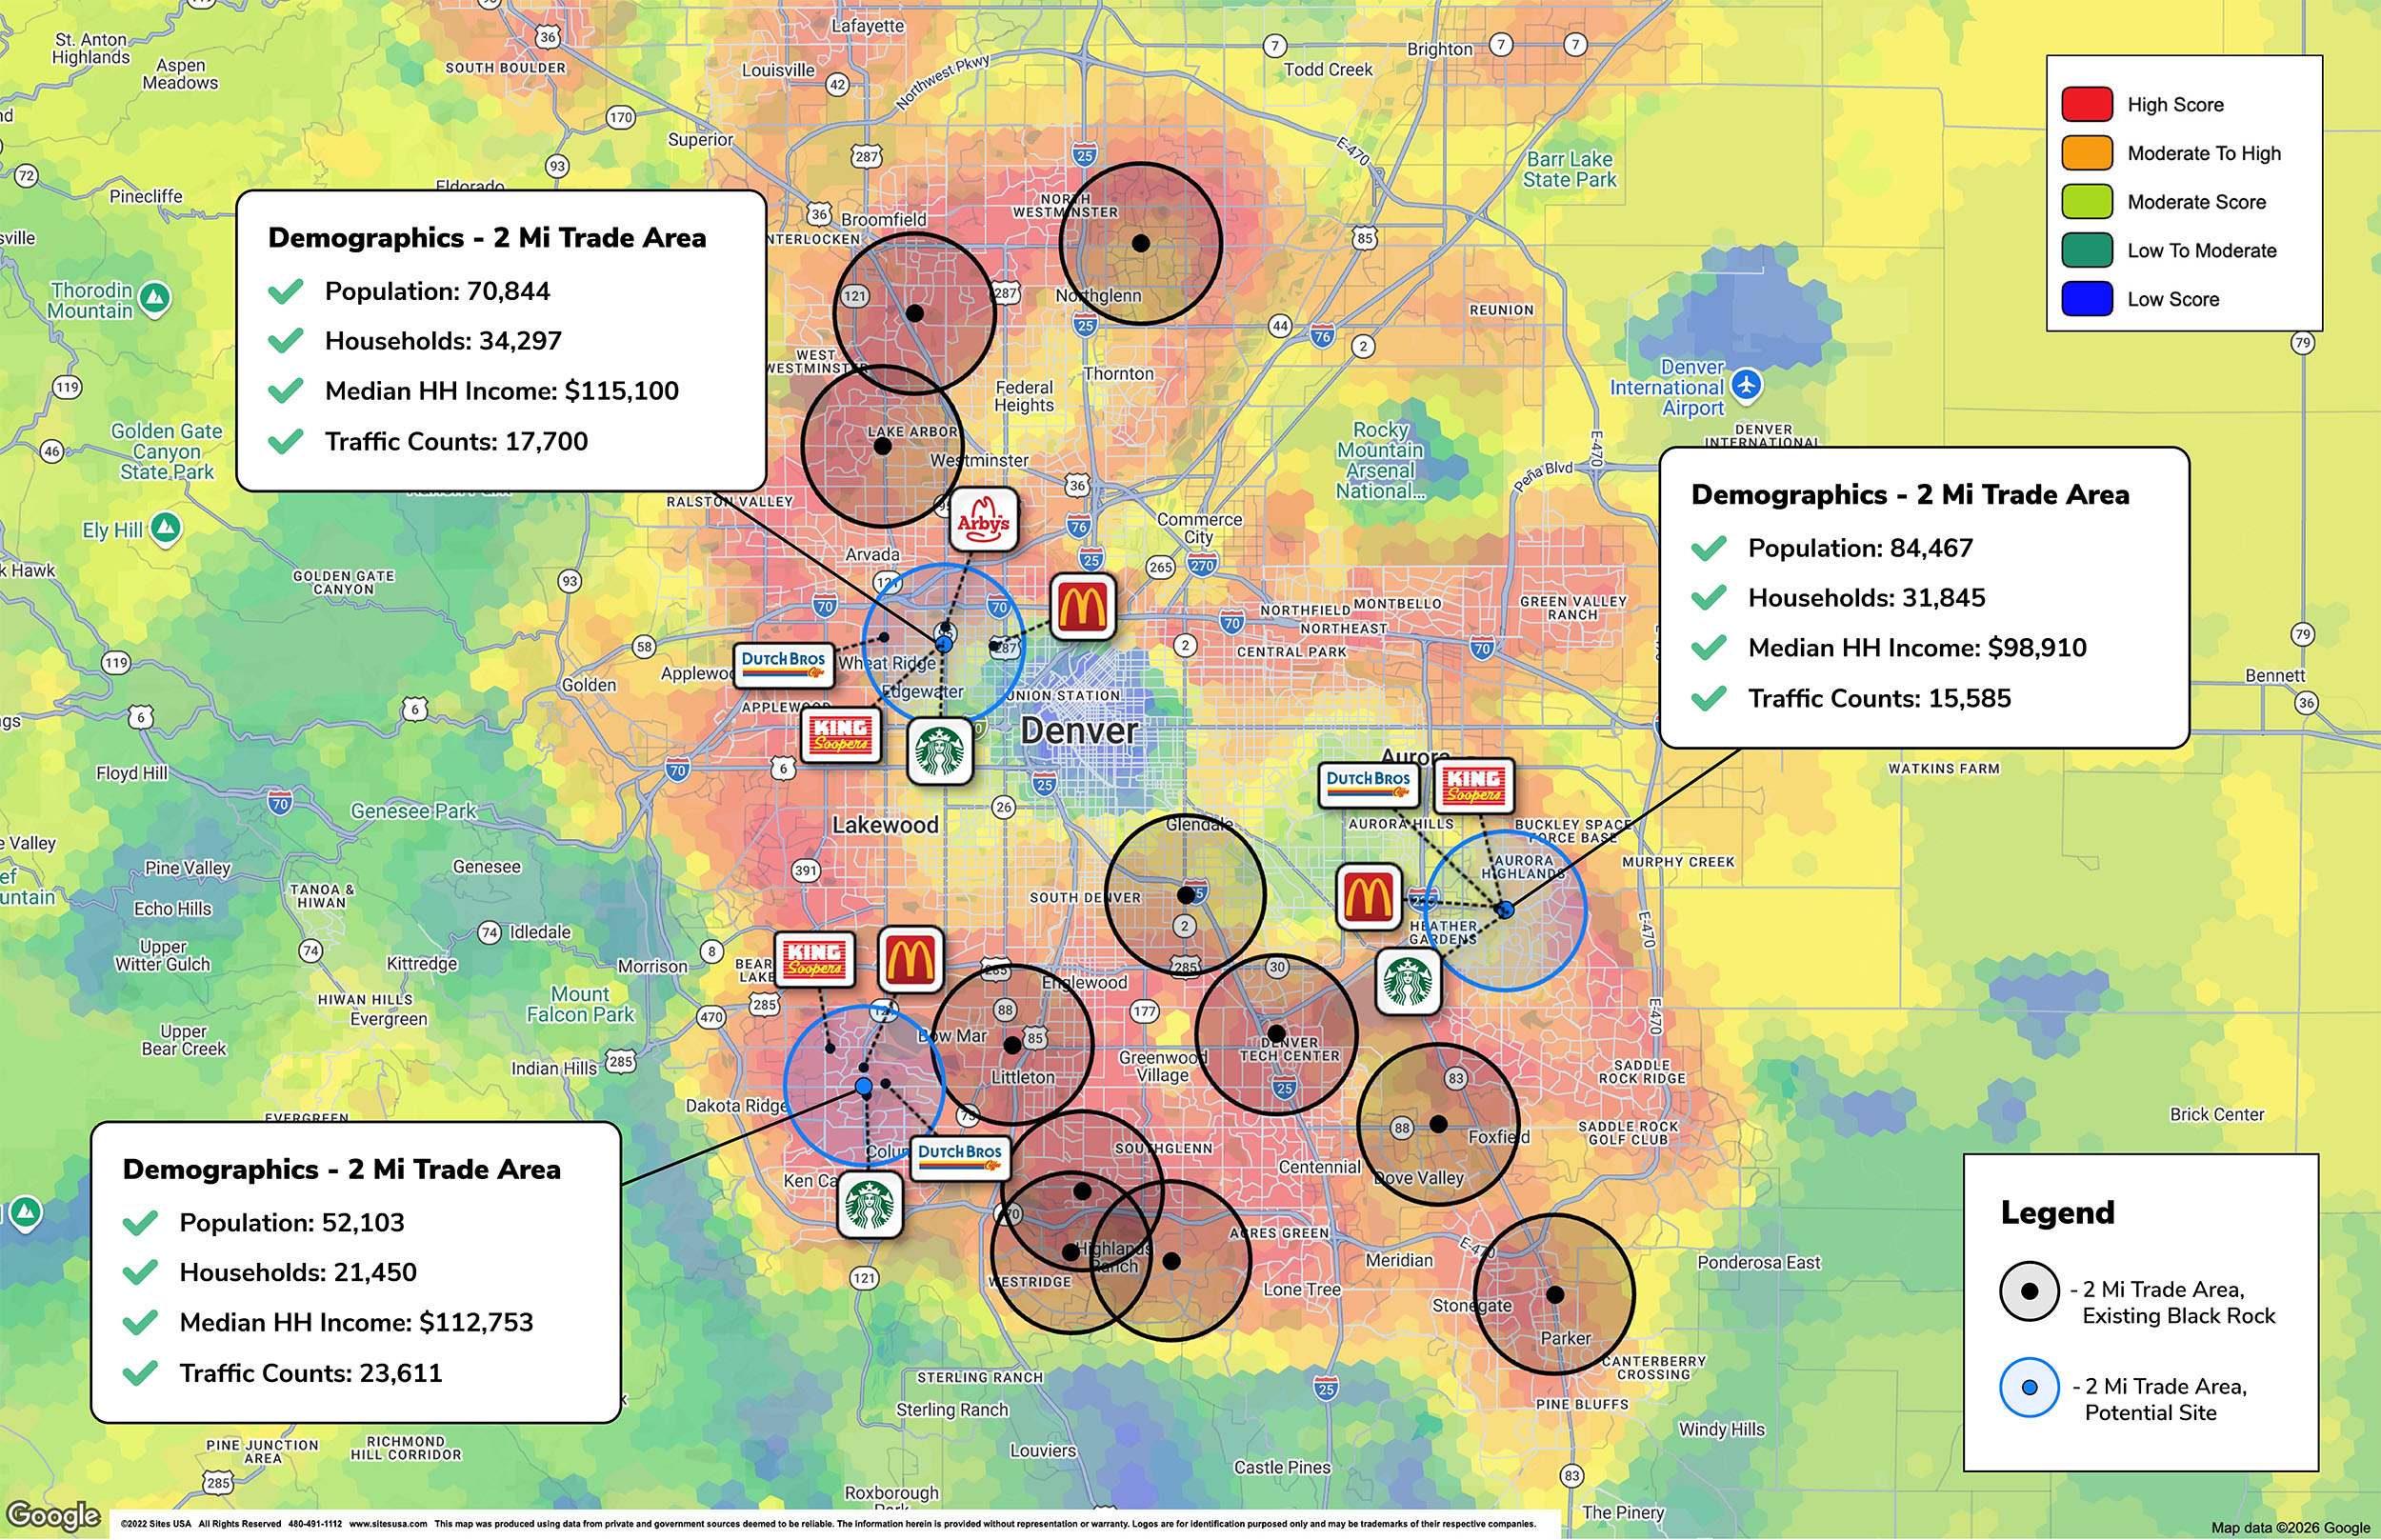
For the market optimization study we're going to be running, we'll need to find the averages of each demographic variable we'll be using for the study so that the tool can find that ideal value in our market. Our settings for the market optimization are targeting our ideal range in population, households median income, traffic counts and areas that contain our common retailers nearby while avoiding current Black Rock locations.
Once the heat map has been created, we can see that there are hotspots surrounding the downtown Denver area mainly in high residential areas. We used the top ranked recommended sites as a starting point, then checked merchant data to find where our preferred retailers are leading to us finding three potential sites that fit our site criteria.
| Site Criteria | Our Profile | Site 1 | Site 2 | Site 3 |
|---|---|---|---|---|
| Population | 35,000 - 60,000 | 70,844 | 52,103 | 84,467 |
| Households | 15,000 - 30,000 | 34,297 | 21,450 | 31,845 |
| Median Household Income | $97,000 - $130,000 | $115,100 | $115,753 | $98,910 |
| Traffic Counts | 15,000 - 25,000 | 17,700 | 23,611 | 15,585 |
| Common Nearby Retailers | Arby's, Starbucks, McDonald's, King Soopers, Dutch Bros | Arby's, Starbucks, McDonald's, King Soopers, Dutch Bros | Starbucks, McDonald's, King Soopers, Dutch Bros | Starbucks, McDonald's, King Soopers, Dutch Bros |
If we could find these sites, imagine what you could find when you pair powerful tools and data with your in-depth knowledge of your market. Site selection software is essential in the commercial real estate industry and can do more than just help you locate potential sites. With accurate data, easy to read reports, a user friendly mapping interface and more, REGIS Online saves you time and enhances the site analysis process. Learn more about REGIS Online or schedule a demo and see what the software can do yourself!
Last Modified November 17, 2026
How do you find sites for an expanding retailer?
Map the retailer’s existing stores, add trade areas around each one, and pull demographics and nearby retailers for every trade area. That’ll determine the range of your site criteria and tell you what to look for in areas that don’t already have a store.
What should you look for in trade area analysis software?
You’ll want a software that allows you to map multiple types of trade areas, provides demographic reports, shows nearby merchants and provides traffic counts. The software should also have mapping capabilities and easy to read reports so that you can share your findings with a client.
How do you build site criteria from a retailer’s existing stores?
Start with mapping every existing store, next draw the same trade area for each, and then gather your desired demographic variables from each store’s trade area. Determine the range and average of these demographics to get an understanding of what to look for in a potential site. Averages help you narrow your focus but ranges allow you to consider strong sites that may be slightly off.
Is a commercial real estate mapping software necessary for site selection?
Commercial real estate mapping software is crucial for site selection. Using one of these softwares tells the whole site story by visualizing what is within your market and providing you with data that backs up your intuition leading to stronger site selection.
How to know if a potential site is actually viable?
Aside from using general demographic information to find areas where your audience is concentrated, you can also pair other tools like construction data to see what is in development in those areas and active listings data which shows you actual listings for sale or for lease.